PMIC of Lazuli Pamir Consulting
Infographics
PMBOK® Guide 8th Edition Structure
PMBOK® Guide 8th Edition Structure
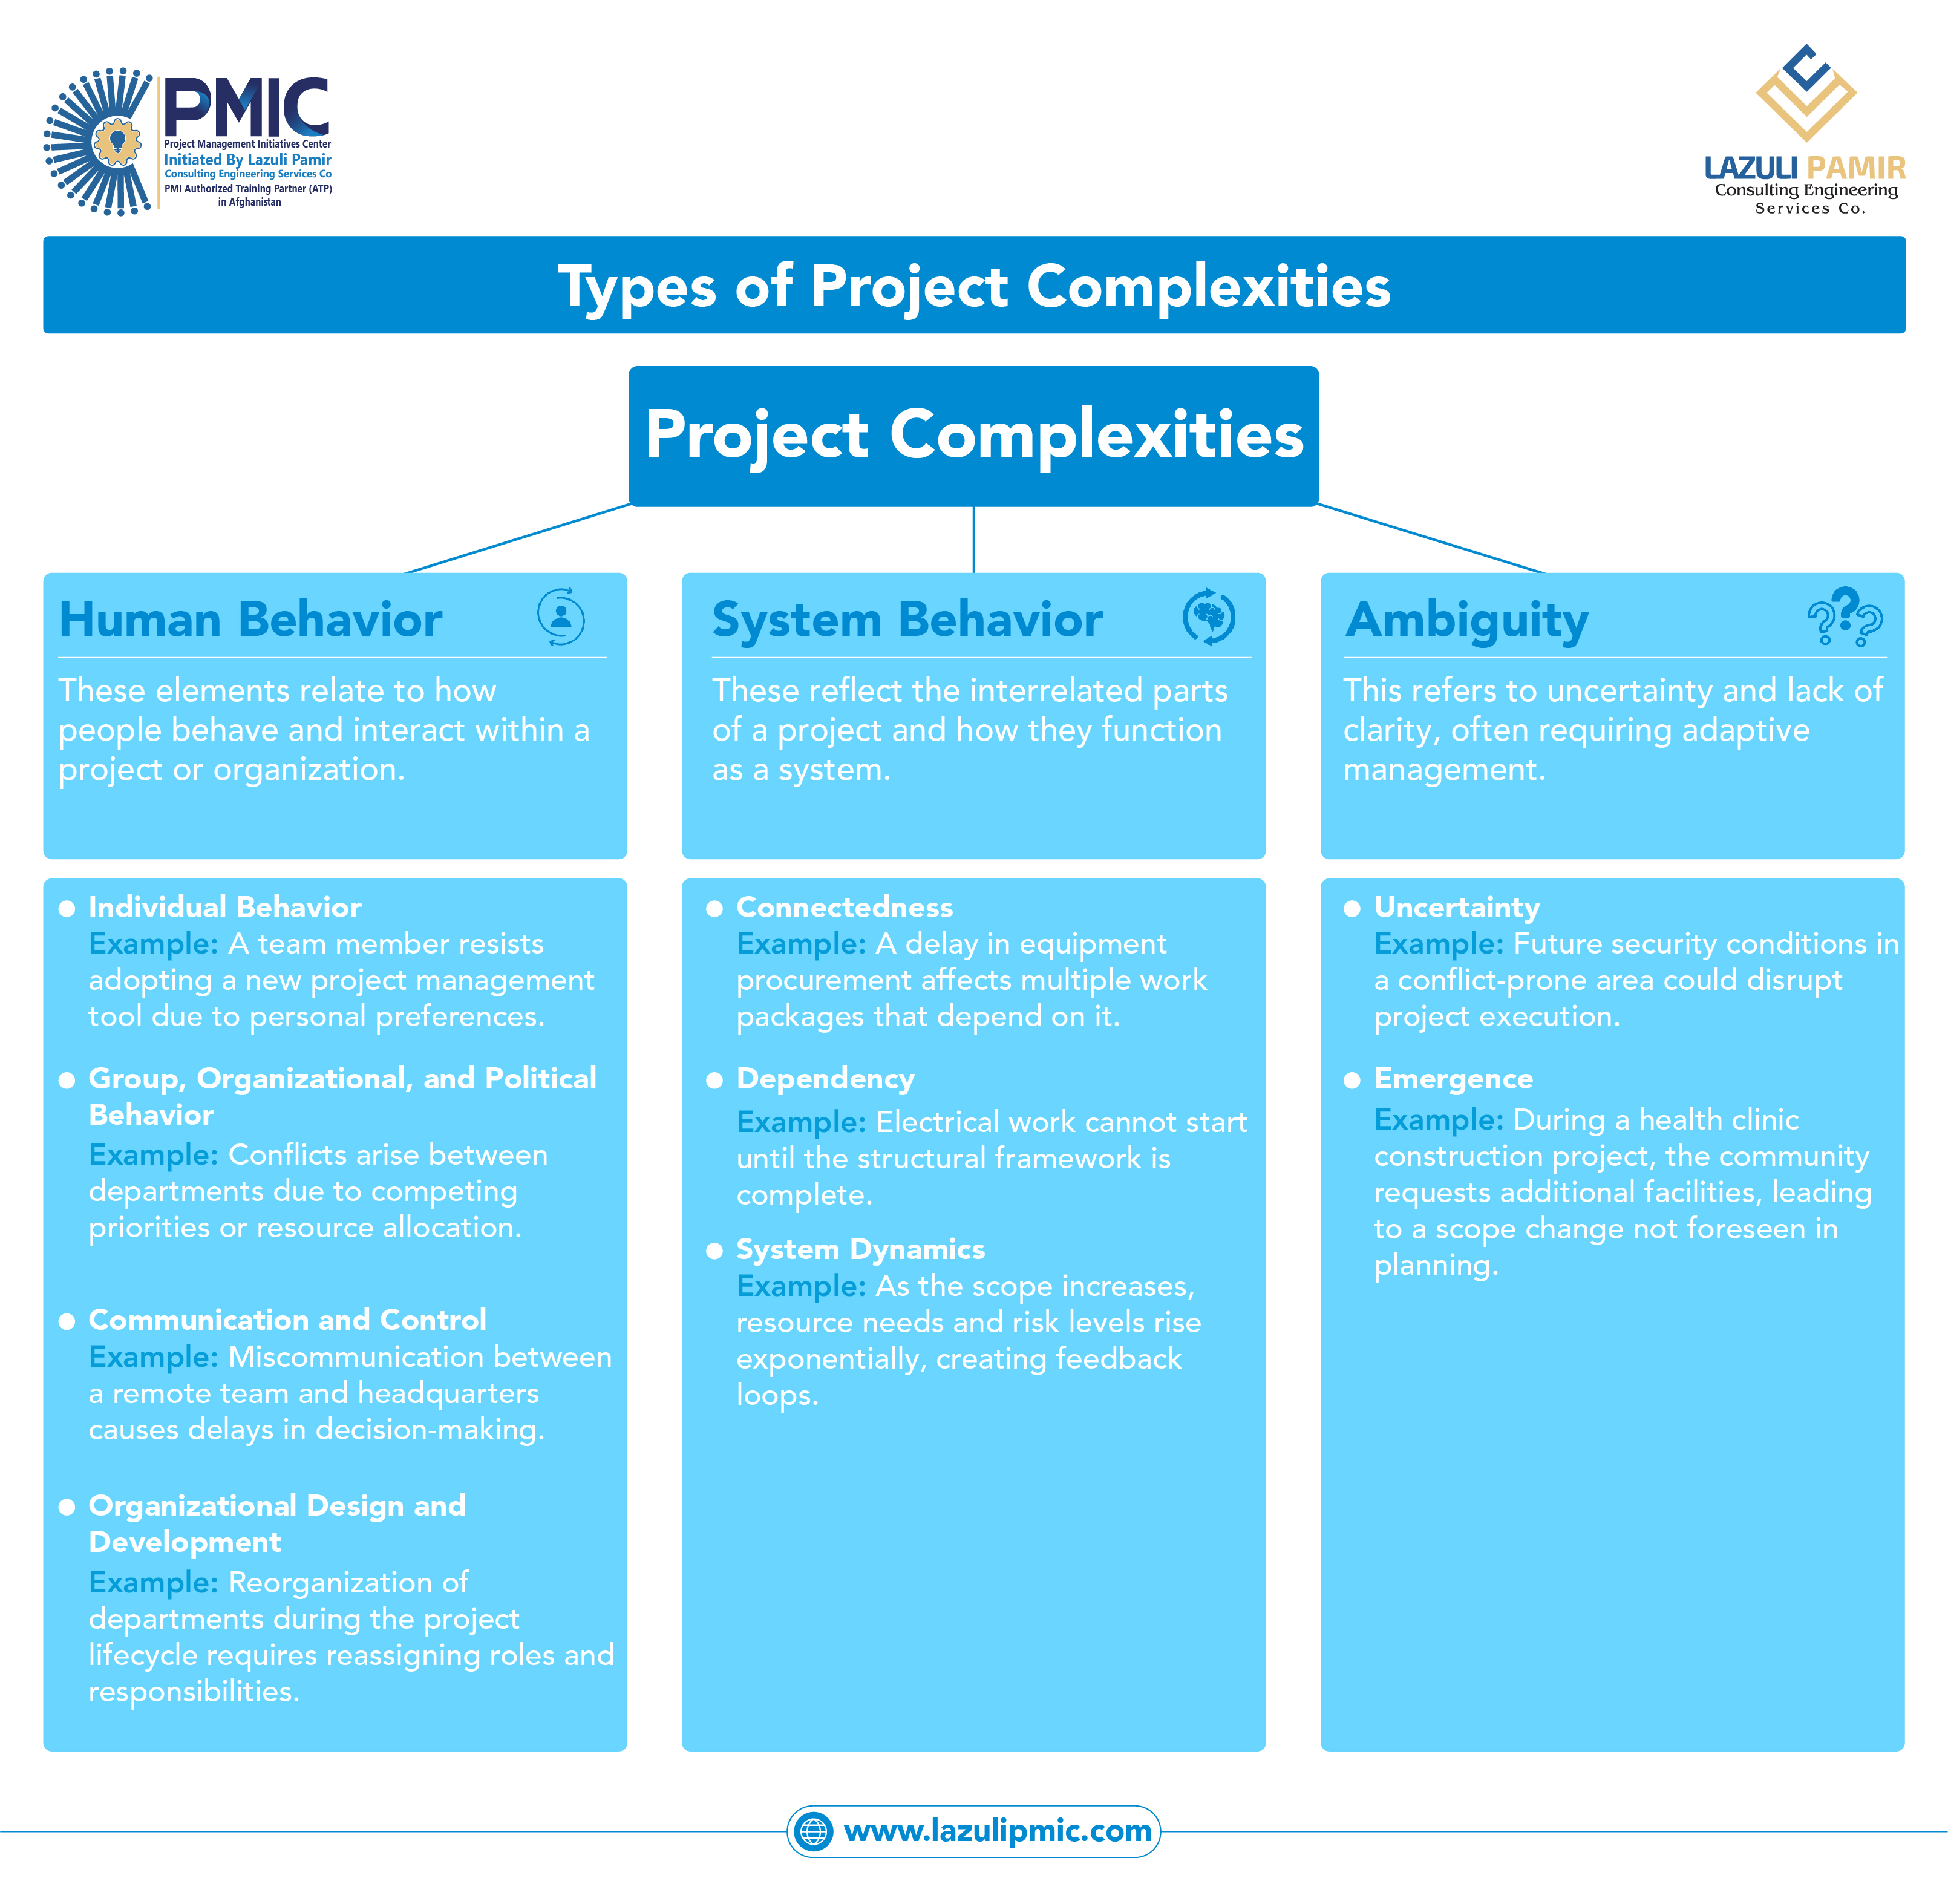
Types of Project Complexities – Human Behavior, System Behavior, and Ambiguity
This infographic explains the three primary sources of project complexity as outlined in modern PMI thinking: Human Behavior, System Behavior, and Ambiguity. It highlights how people, interdependencies, and uncertainty interact to increase complexity in projects. With practical examples, it shows why traditional control alone is not enough and why adaptive leadership, systems thinking, and effective communication are essential. This visual is especially valuable for PMP® aspirants and project managers working in dynamic, high-uncertainty environments.
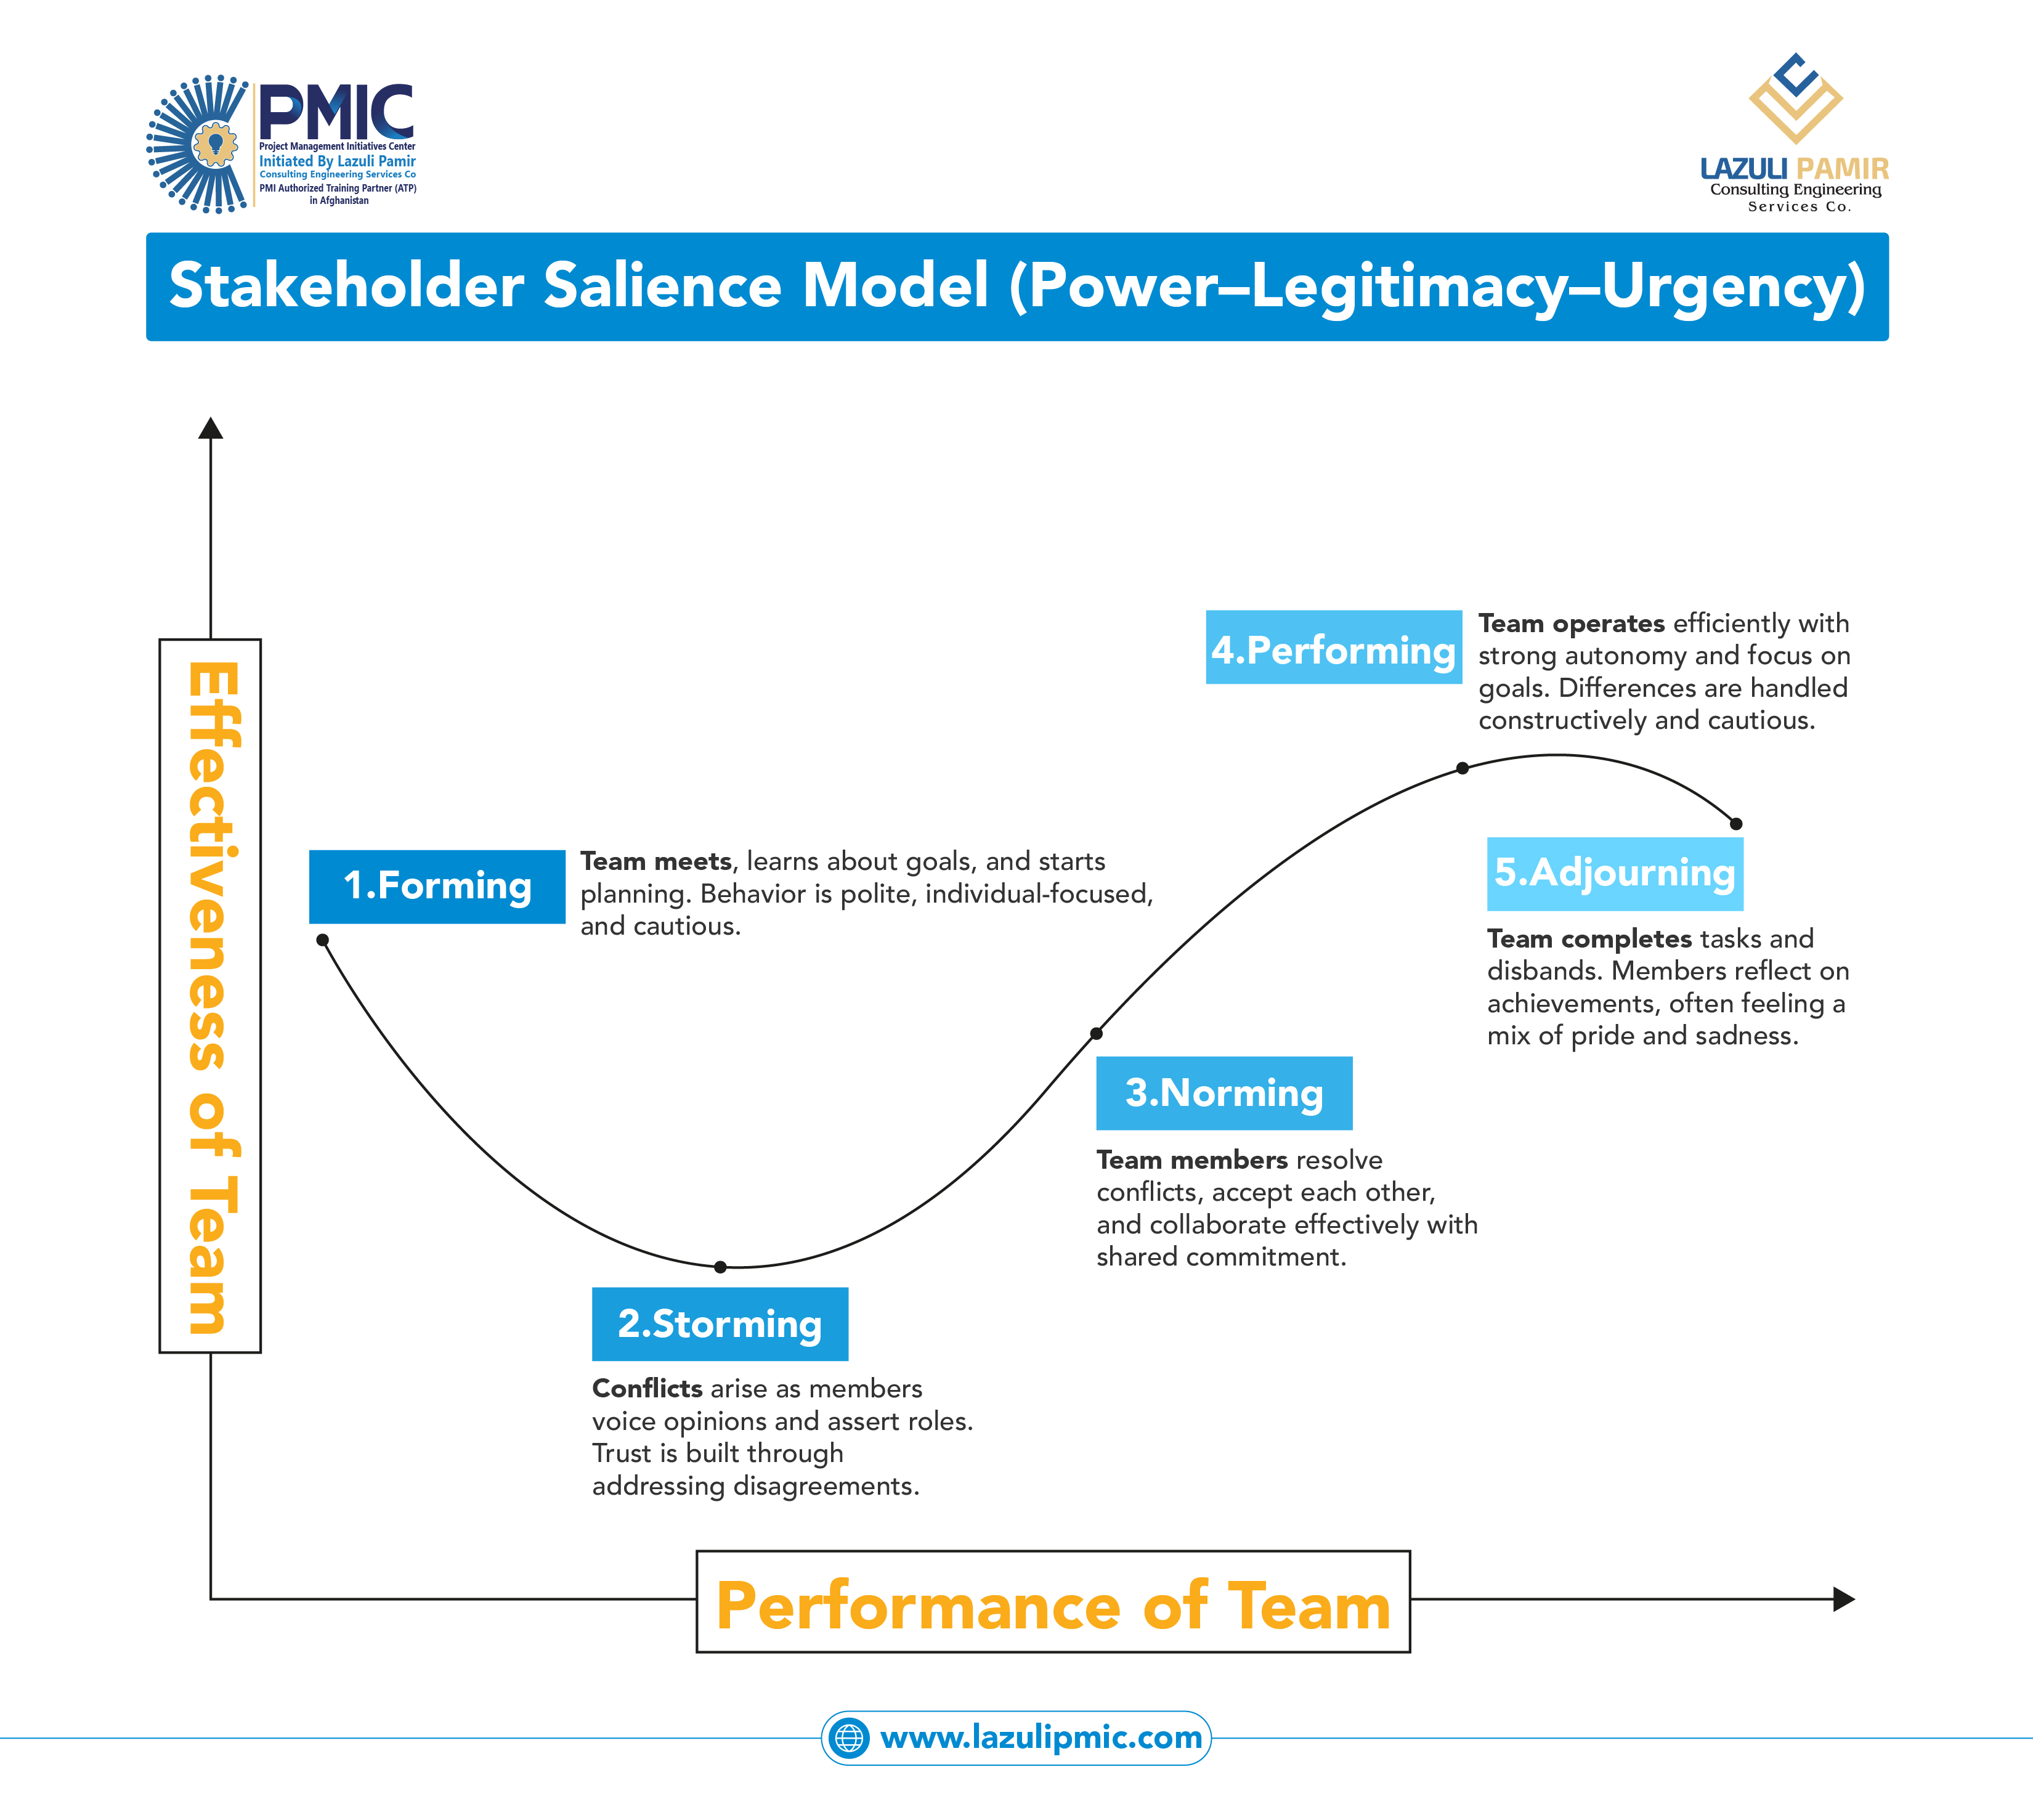
Tuckman’s Team Development Model – From Forming to Adjourning
This infographic illustrates Tuckman’s Team Development Model, showing how teams evolve through five stages: Forming, Storming, Norming, Performing, and Adjourning. It highlights how team effectiveness and performance change over time as members build trust, resolve conflicts, collaborate effectively, and ultimately complete their work. Understanding these stages helps project managers anticipate team behaviors, apply the right leadership approach at each phase, and improve overall project performance in line with PMP® and PMBOK® practices.
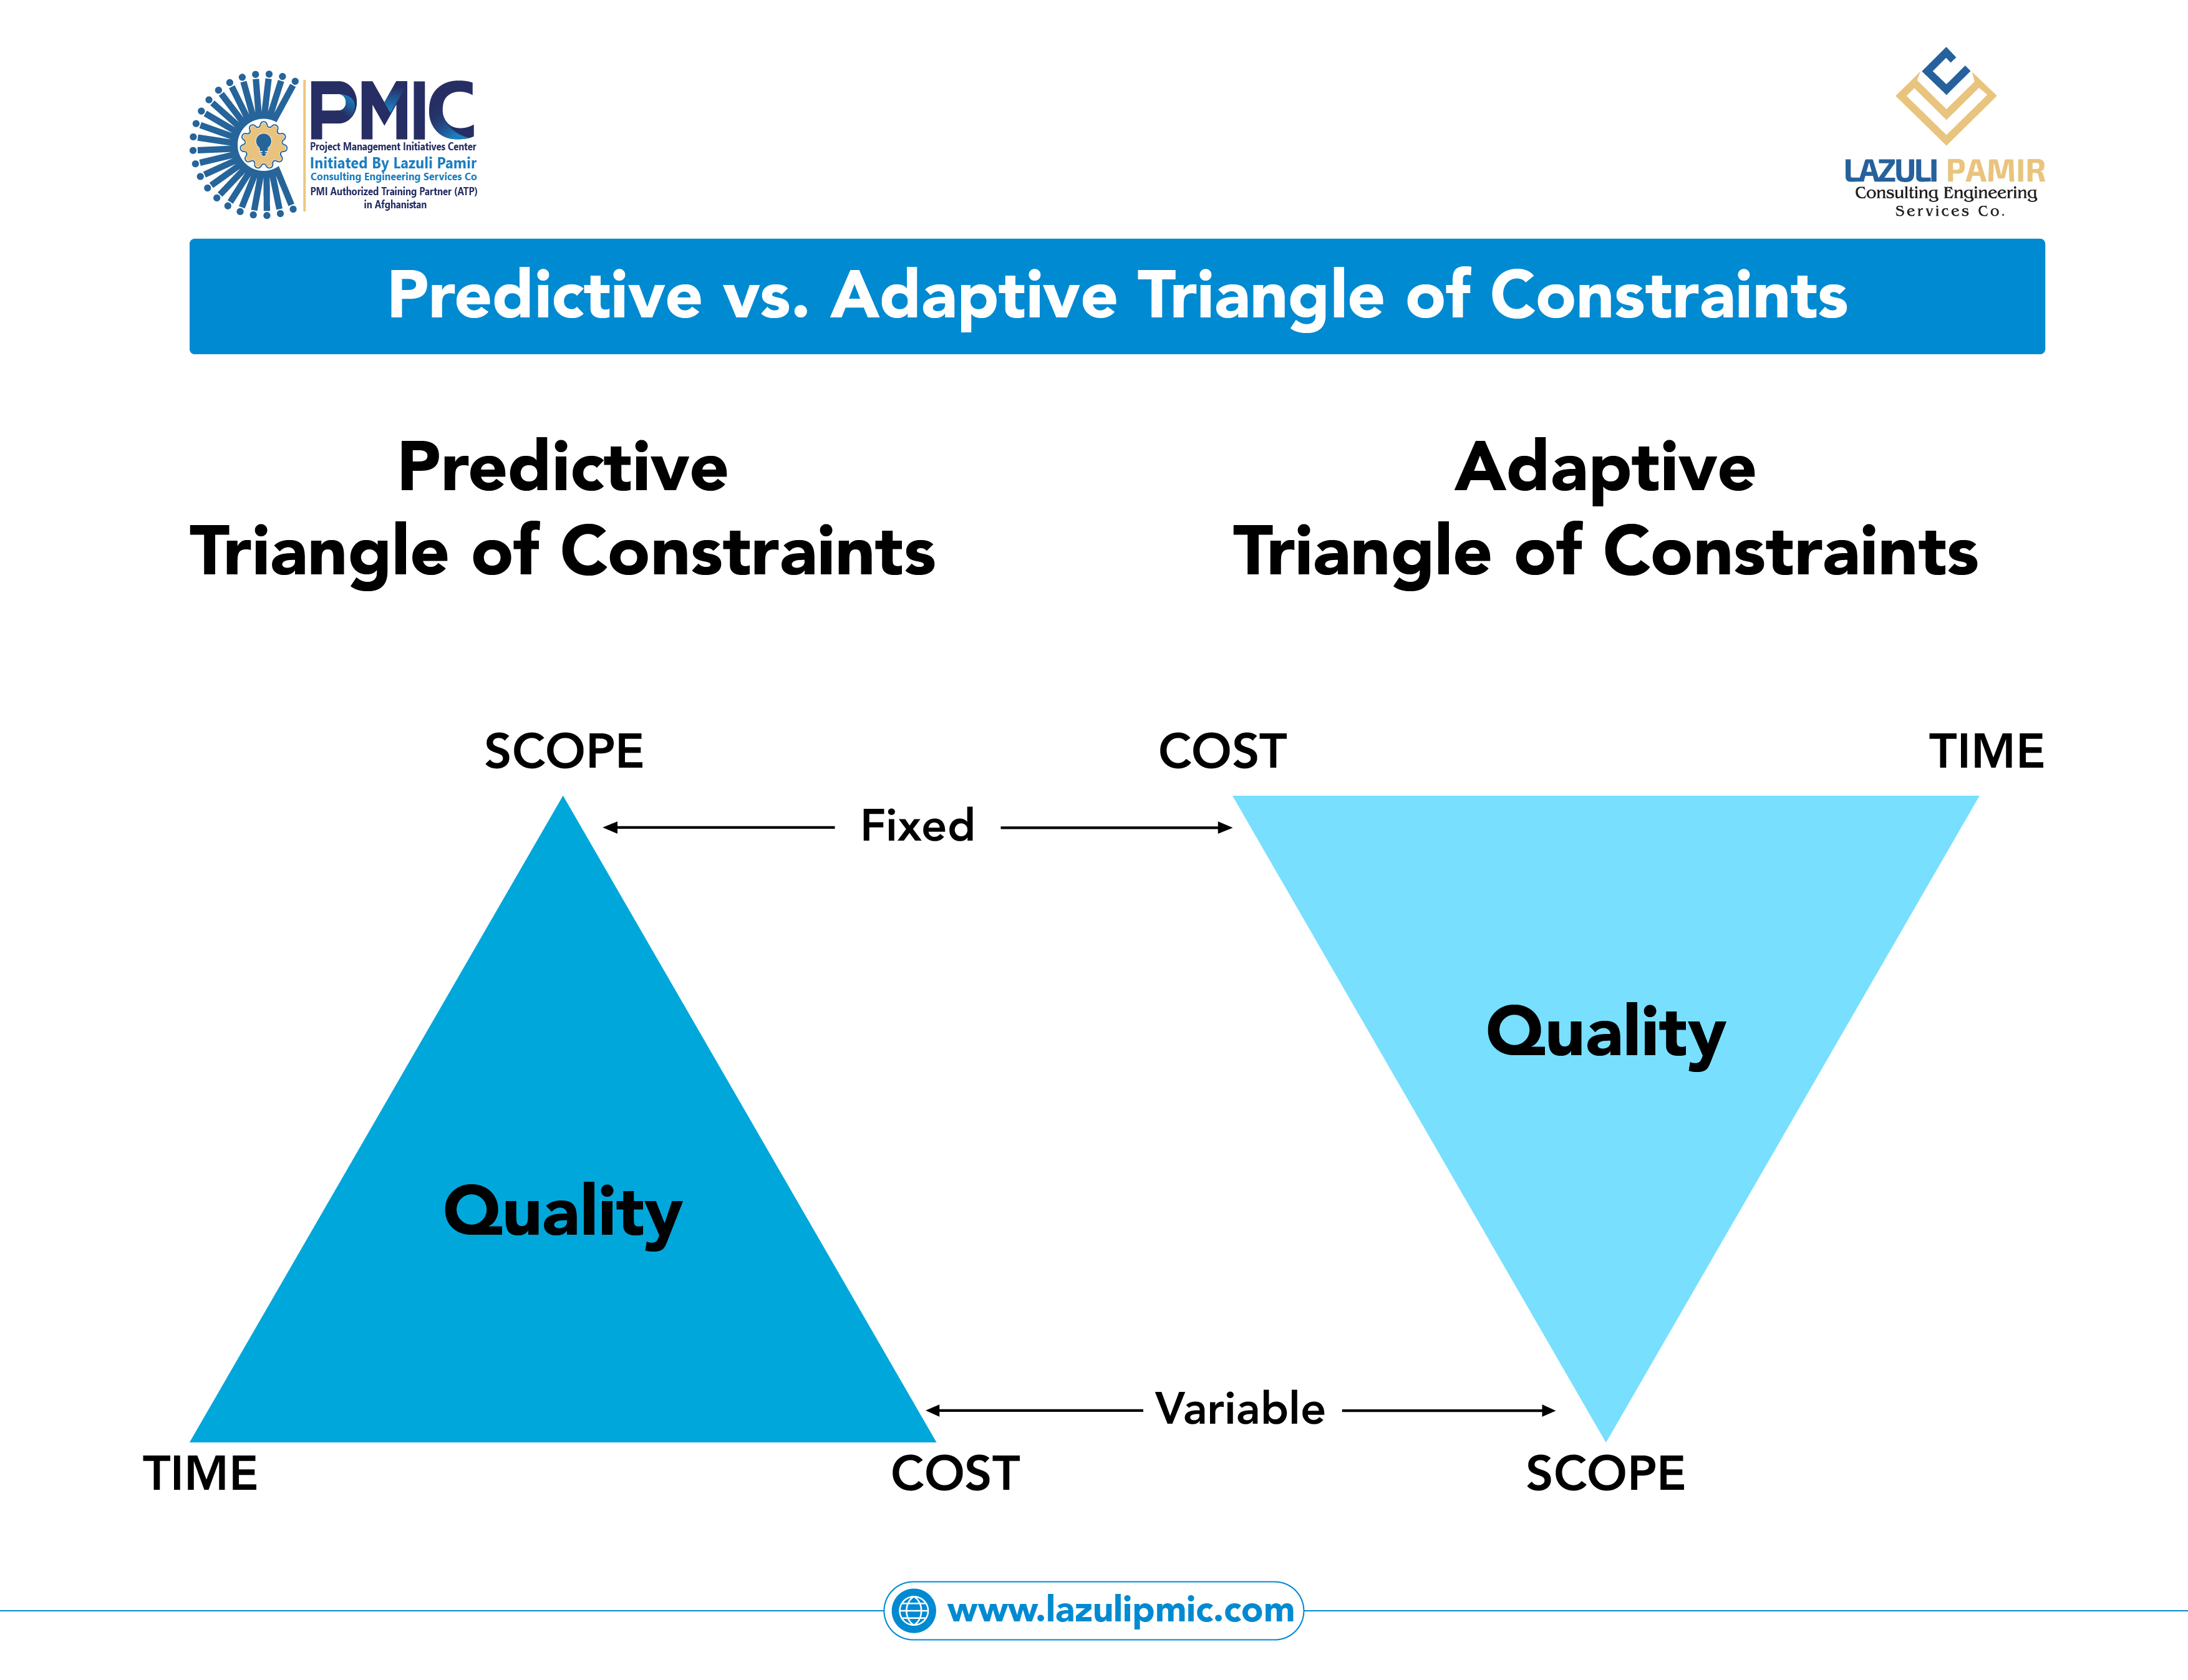
Predictive vs. Adaptive Triangle of Constraints
This infographic compares how the Triple Constraint behaves in Predictive (Waterfall) and Adaptive (Agile) project approaches. In predictive projects, scope is fixed early, while time and cost are adjusted to protect quality. In adaptive projects, time and cost are fixed, and scope remains flexible, evolving through iterations to maximize value while maintaining quality. Understanding this fundamental shift is critical for PMP® aspirants and project managers when selecting the right delivery approach and managing stakeholder expectations.
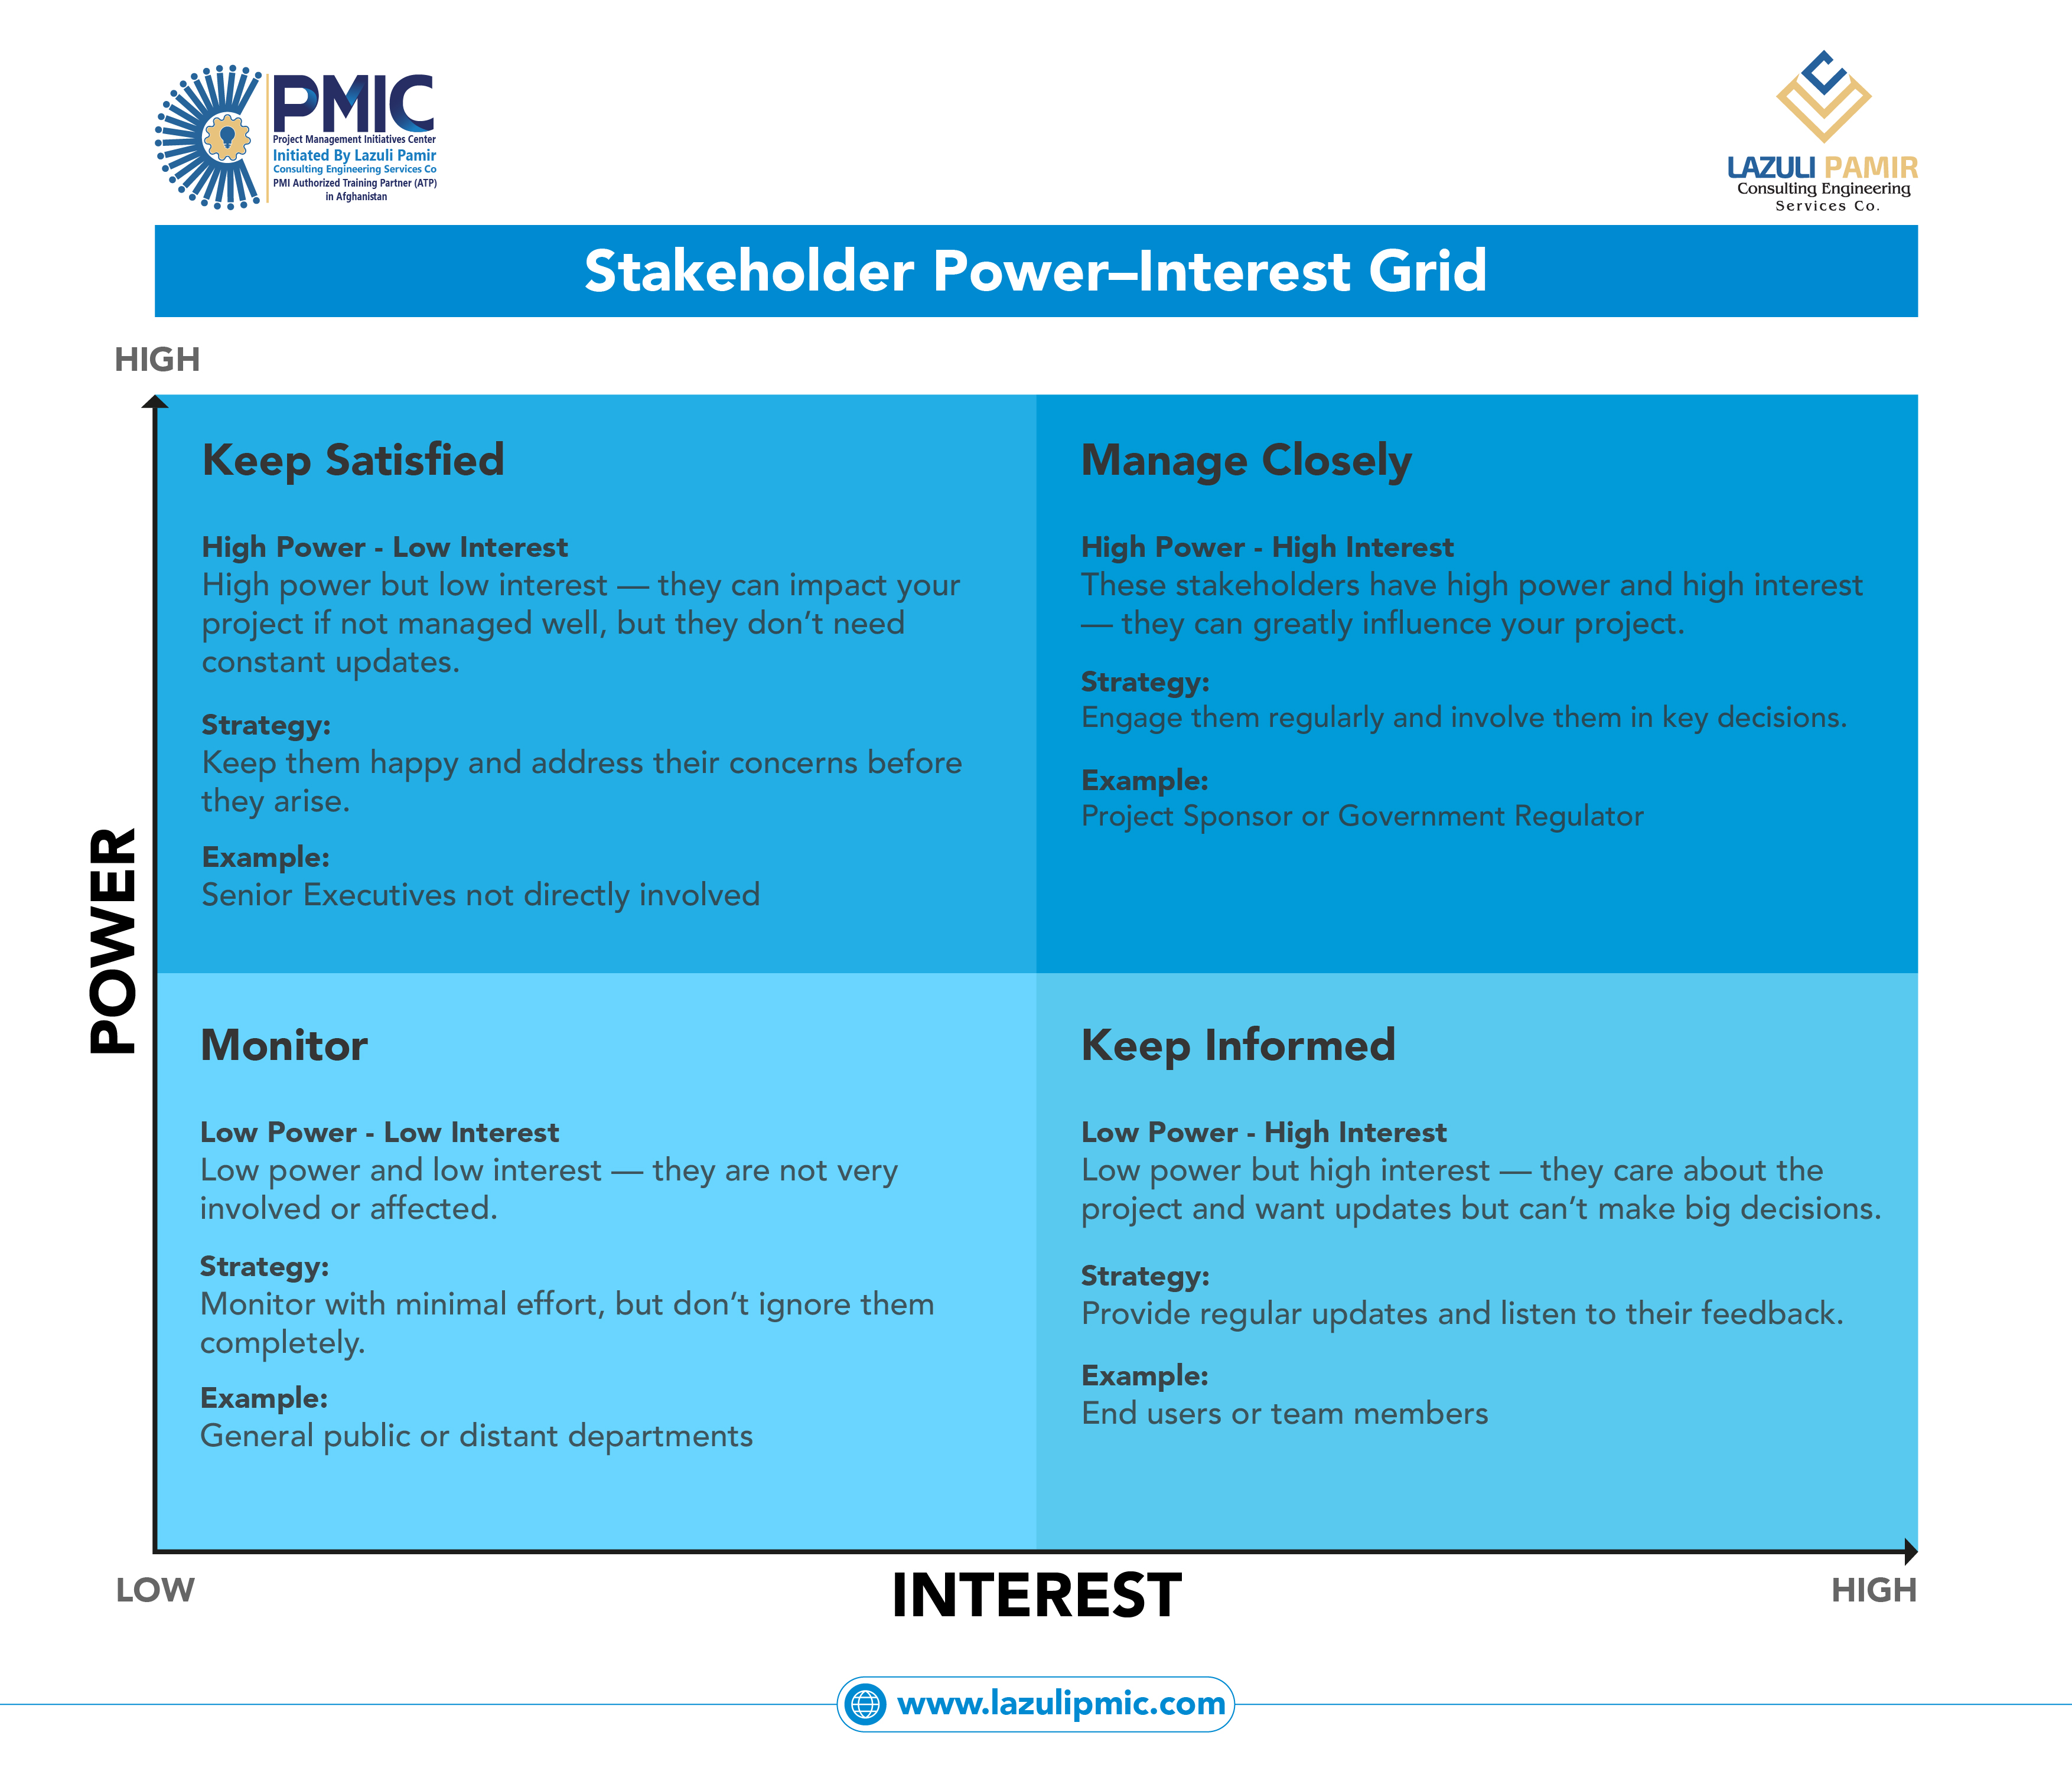
Stakeholder Power–Interest Grid – Prioritizing Stakeholder Engagement
The Stakeholder Power–Interest Grid is a practical tool used to categorize stakeholders based on their level of power and interest in a project. This infographic explains the four key engagement strategies—Manage Closely, Keep Satisfied, Keep Informed, and Monitor—helping project managers determine how much attention and communication each stakeholder requires. Widely used in PMP® and PMBOK® practices, this model supports effective stakeholder management, better decision-making, and improved project outcomes.
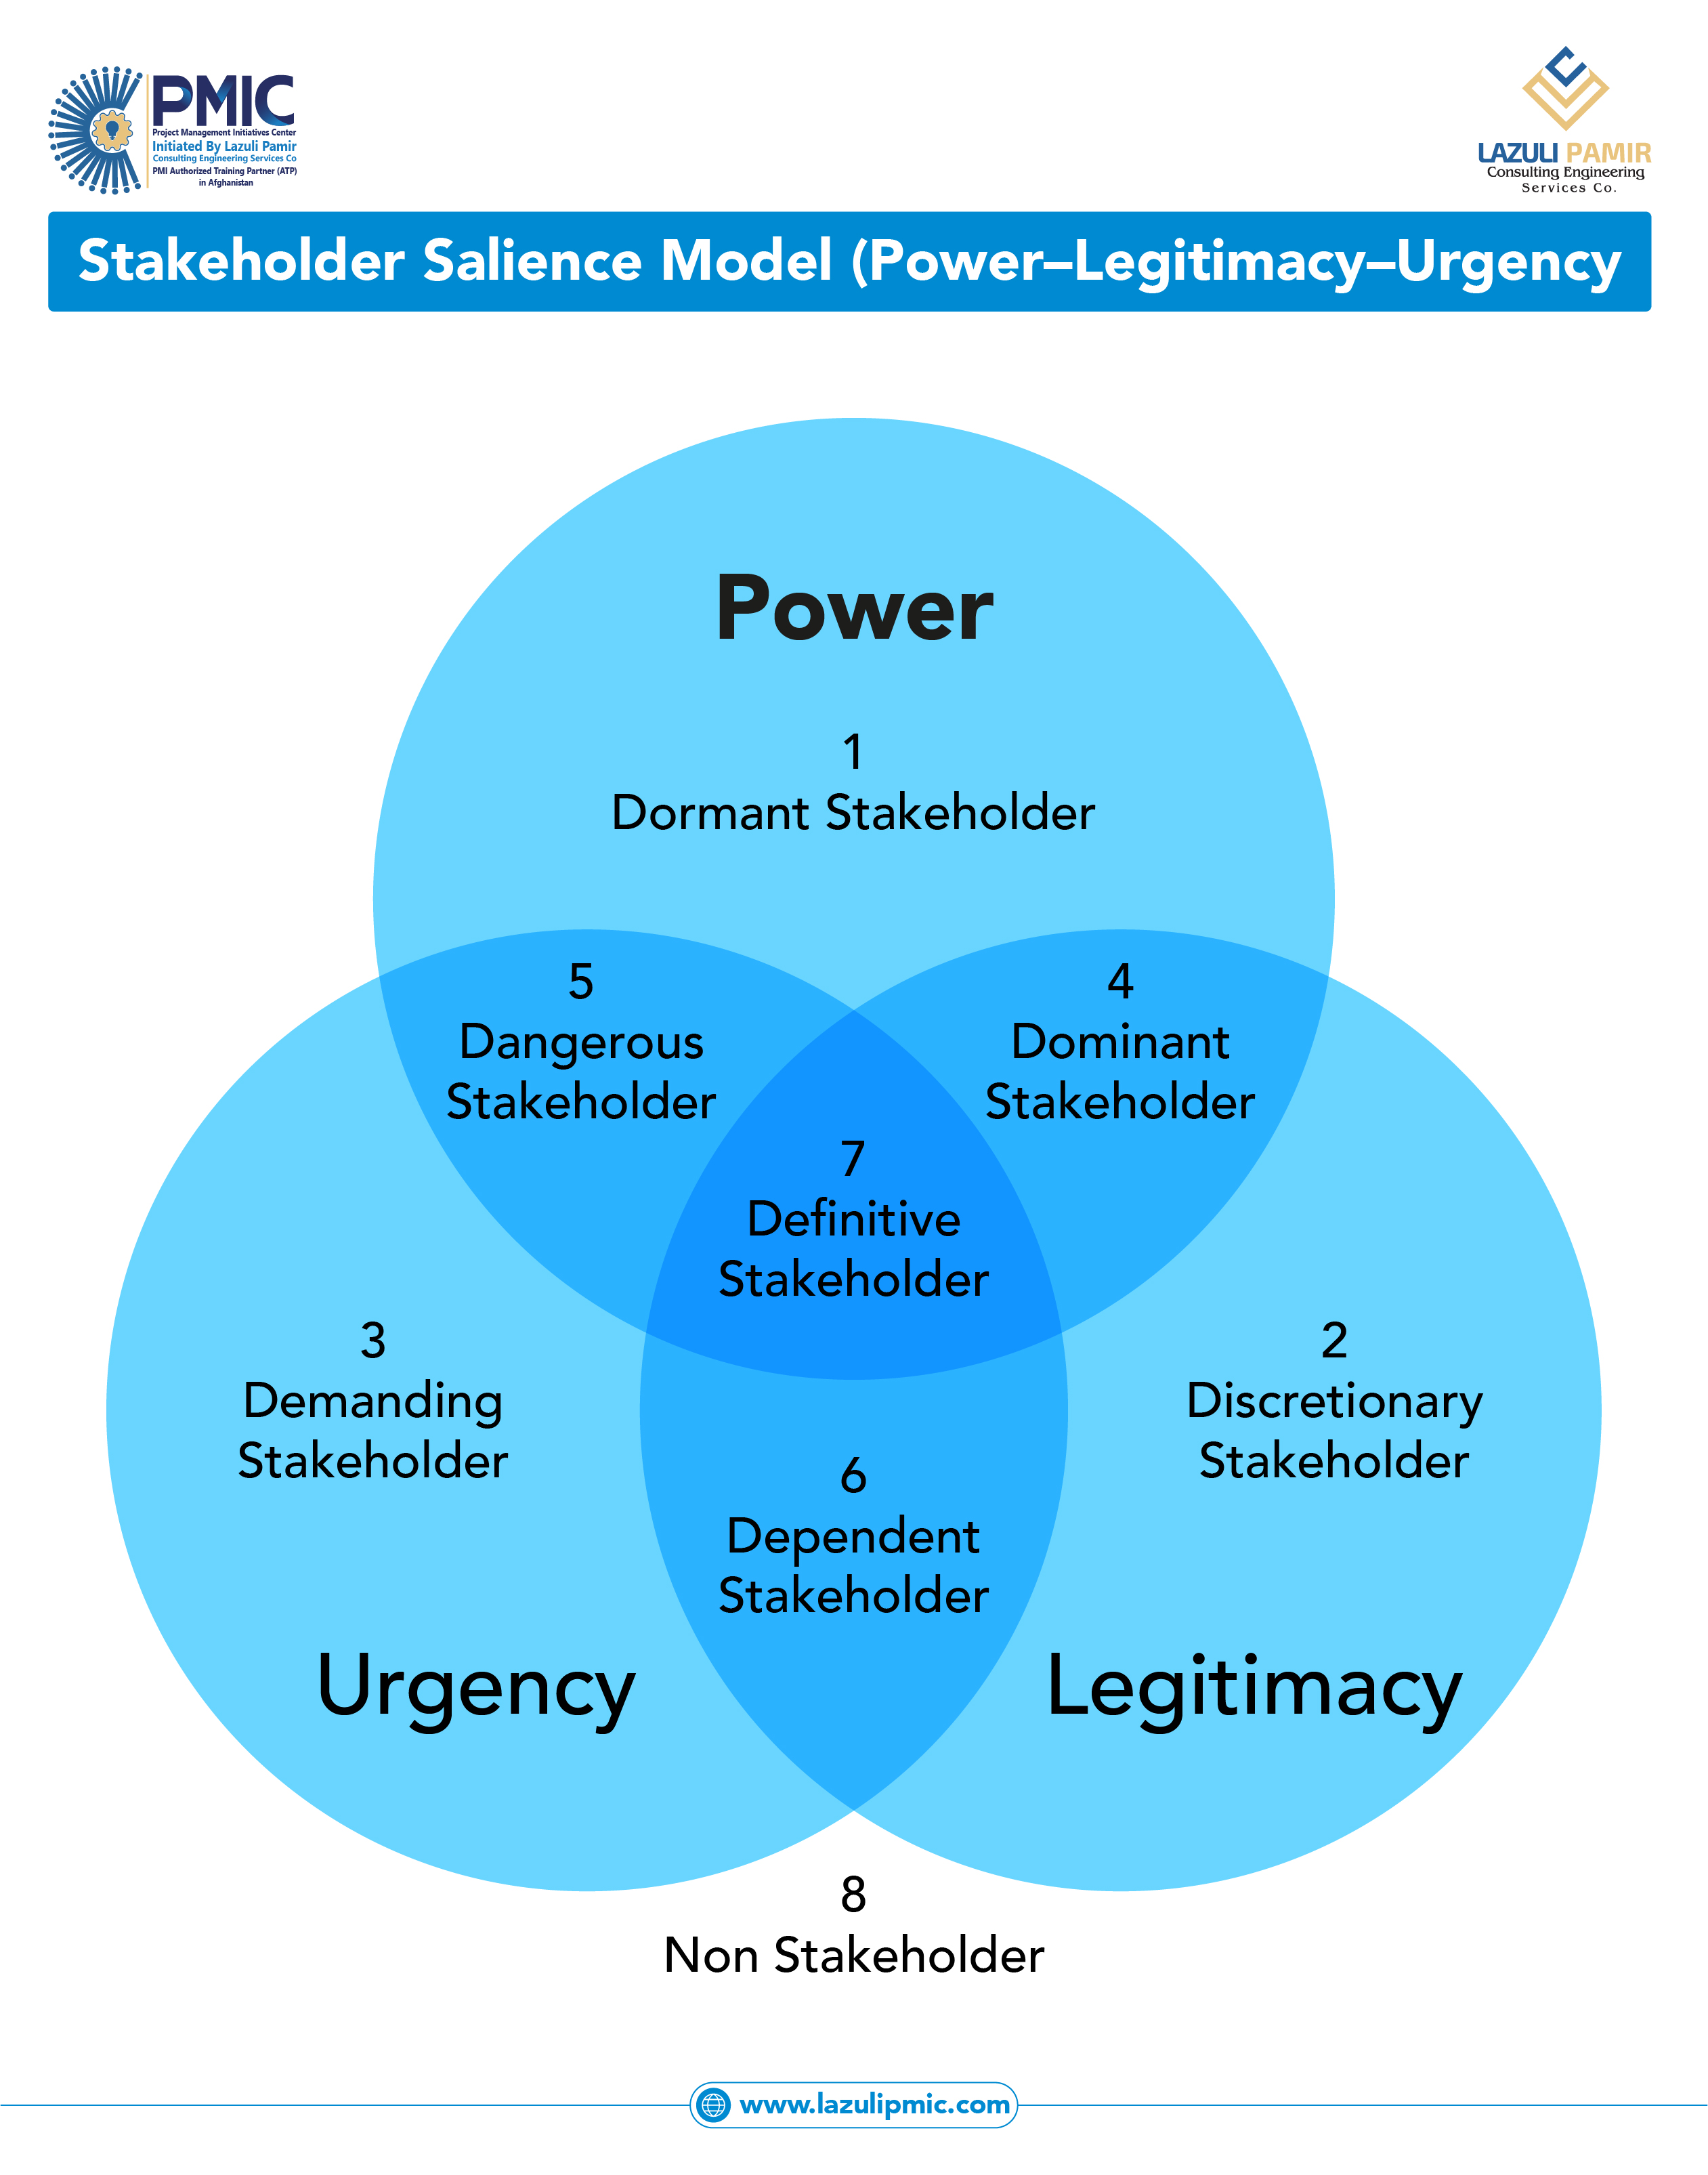
Stakeholder Salience Model – Power, Legitimacy, and Urgency
The Stakeholder Salience Model helps project managers identify and prioritize stakeholders based on three key attributes: power, legitimacy, and urgency. This infographic visually explains the seven stakeholder types—ranging from dormant and discretionary to dominant, dangerous, dependent, and definitive stakeholders—while also distinguishing non-stakeholders. Understanding this model enables project managers to focus attention where it matters most, manage expectations effectively, and apply the right engagement strategies in line with PMBOK® and PMP® best practices.
Project Influences: Understanding EEFs and OPAs
This infographic explains the two major influences on every project according to PMBOK®: Enterprise Environmental Factors (EEFs) and Organizational Process Assets (OPAs). It clearly distinguishes between external and internal EEFs that constrain or shape project decisions, and OPAs such as processes, policies, procedures, and organizational knowledge that support project execution. A simple, structured visual designed to help PMP® aspirants and project professionals quickly understand how projects are influenced beyond the project manager’s direct control.
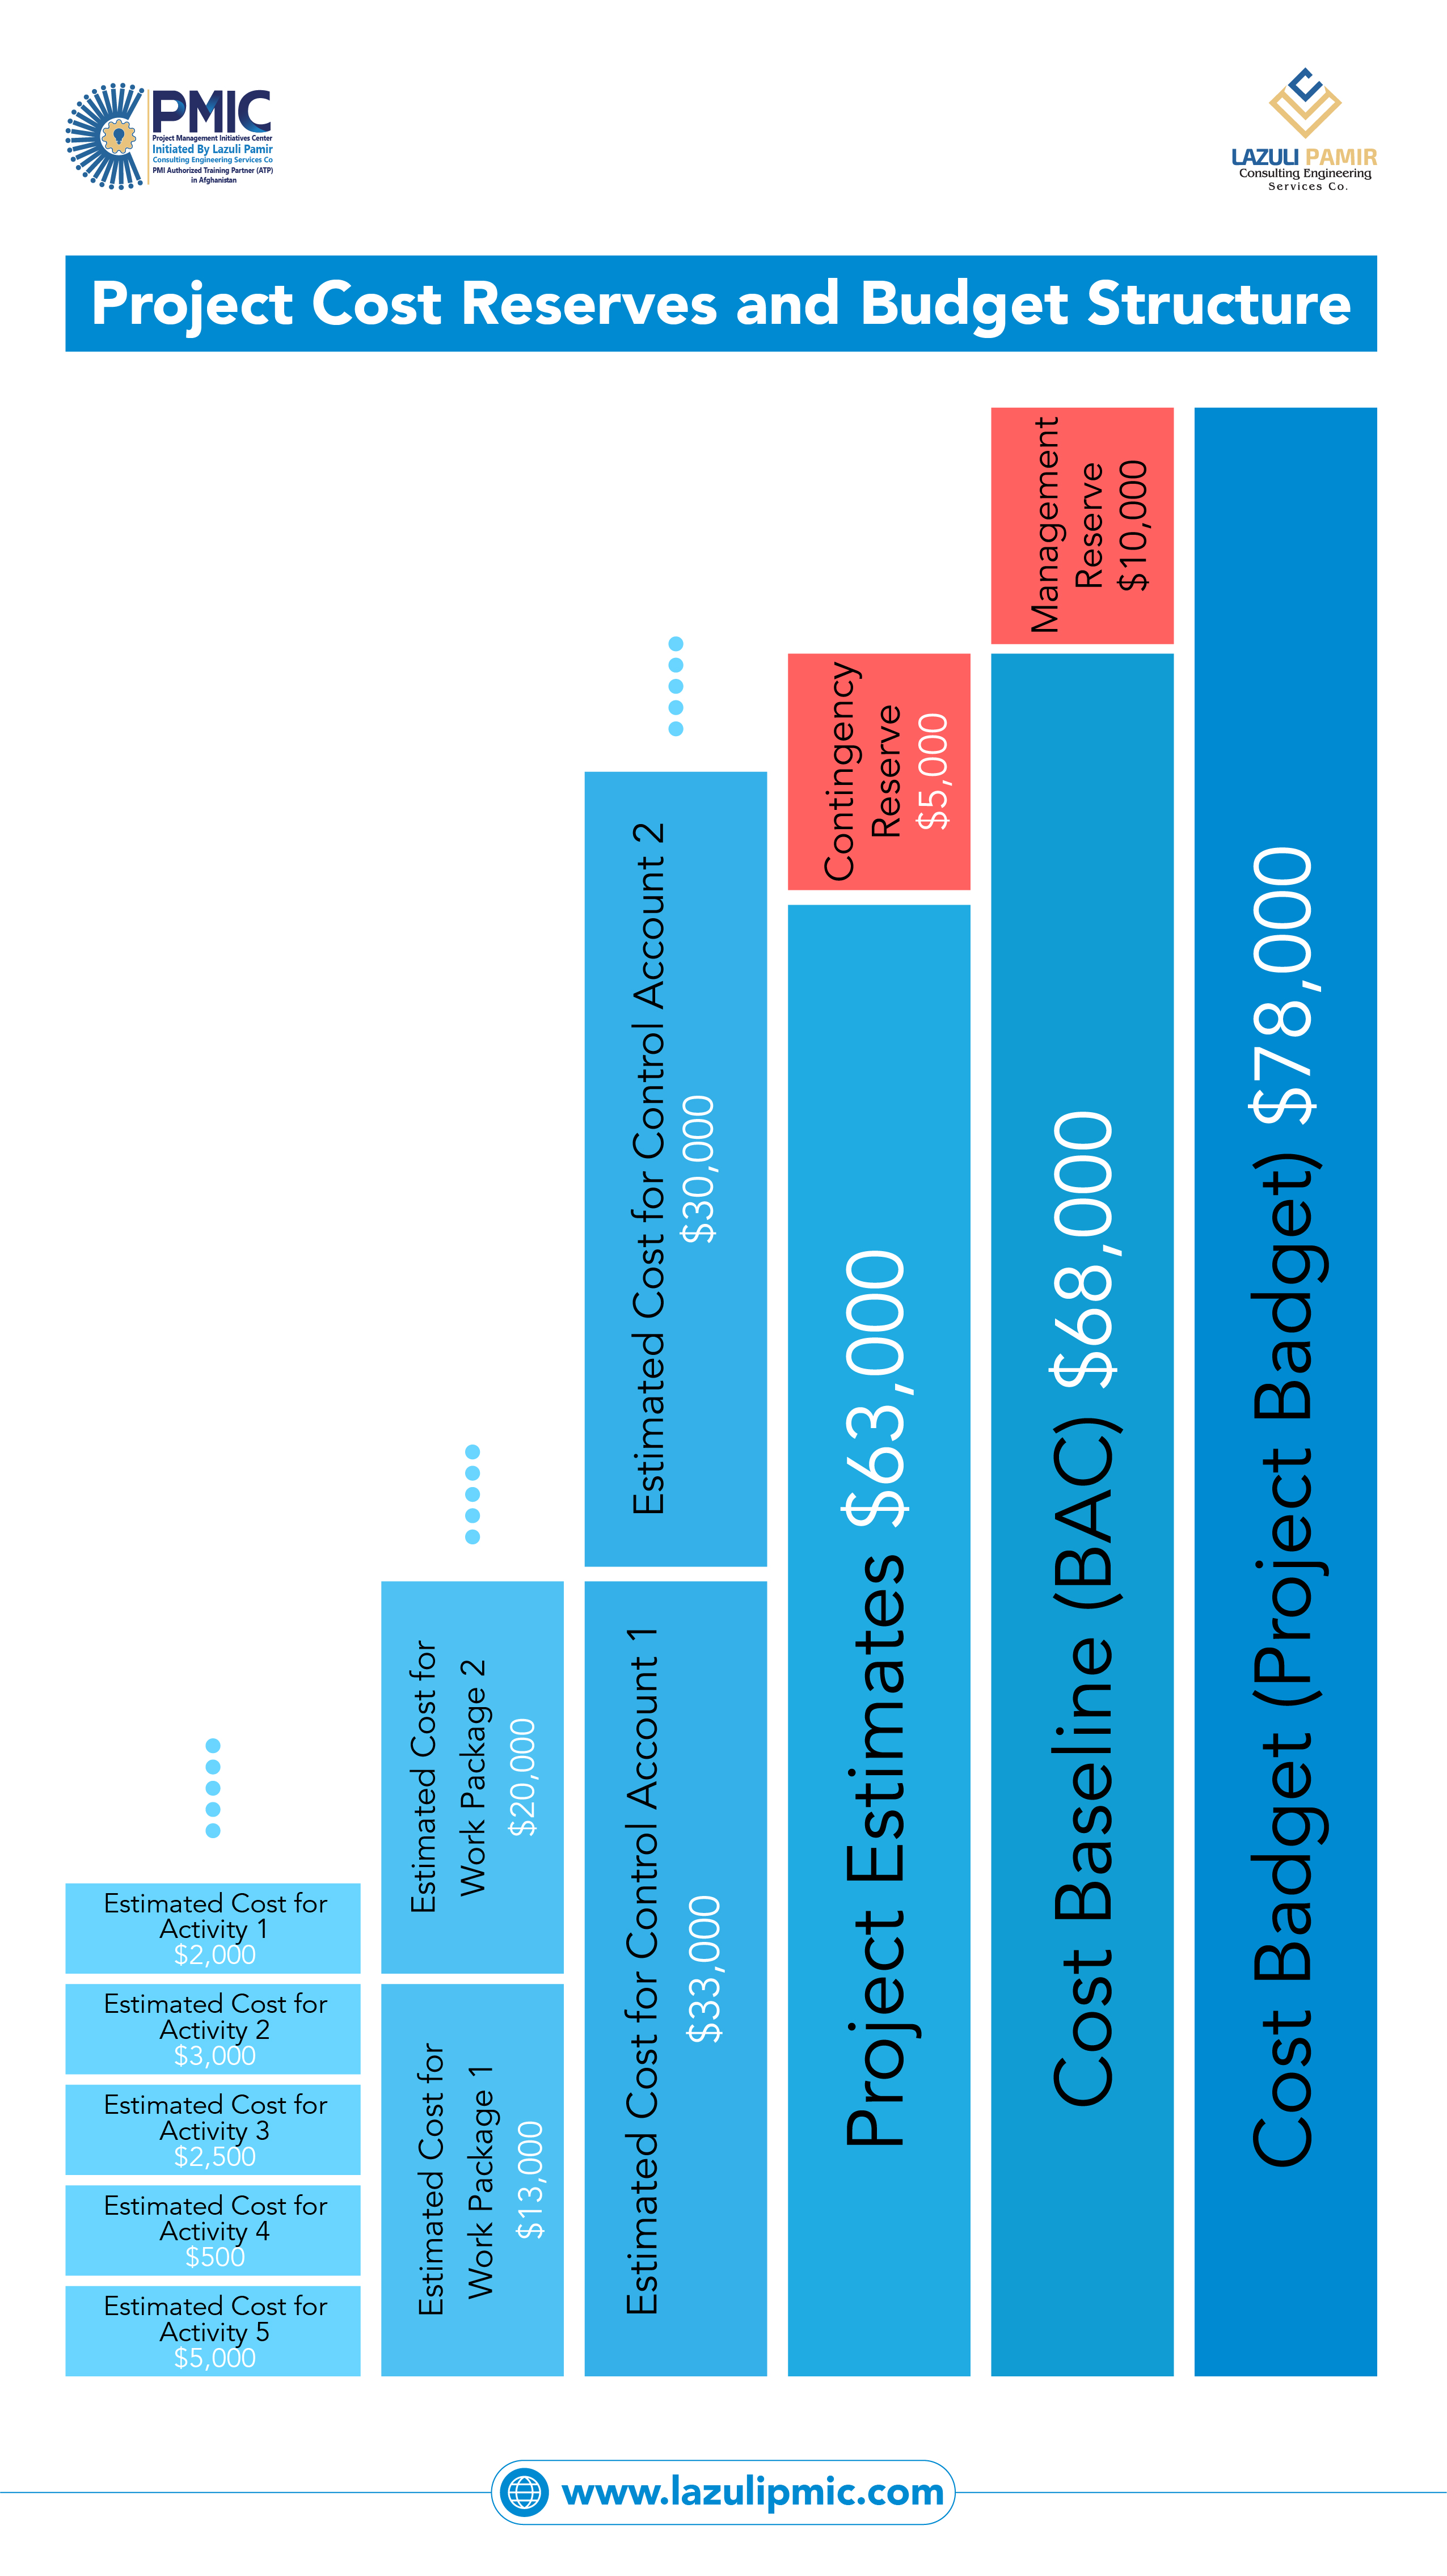
Project Cost Reserves and Budget Structure – From Estimates to Cost Budget
This infographic illustrates how project costs are progressively aggregated—from activity estimates to work packages, control accounts, and the overall project estimate. It clearly shows the relationship between contingency reserve, cost baseline (BAC), and management reserve, helping project managers understand how the total project budget is formed. A practical visual aligned with PMBOK® concepts, ideal for PMP® aspirants and professionals managing cost planning, budgeting, and control.
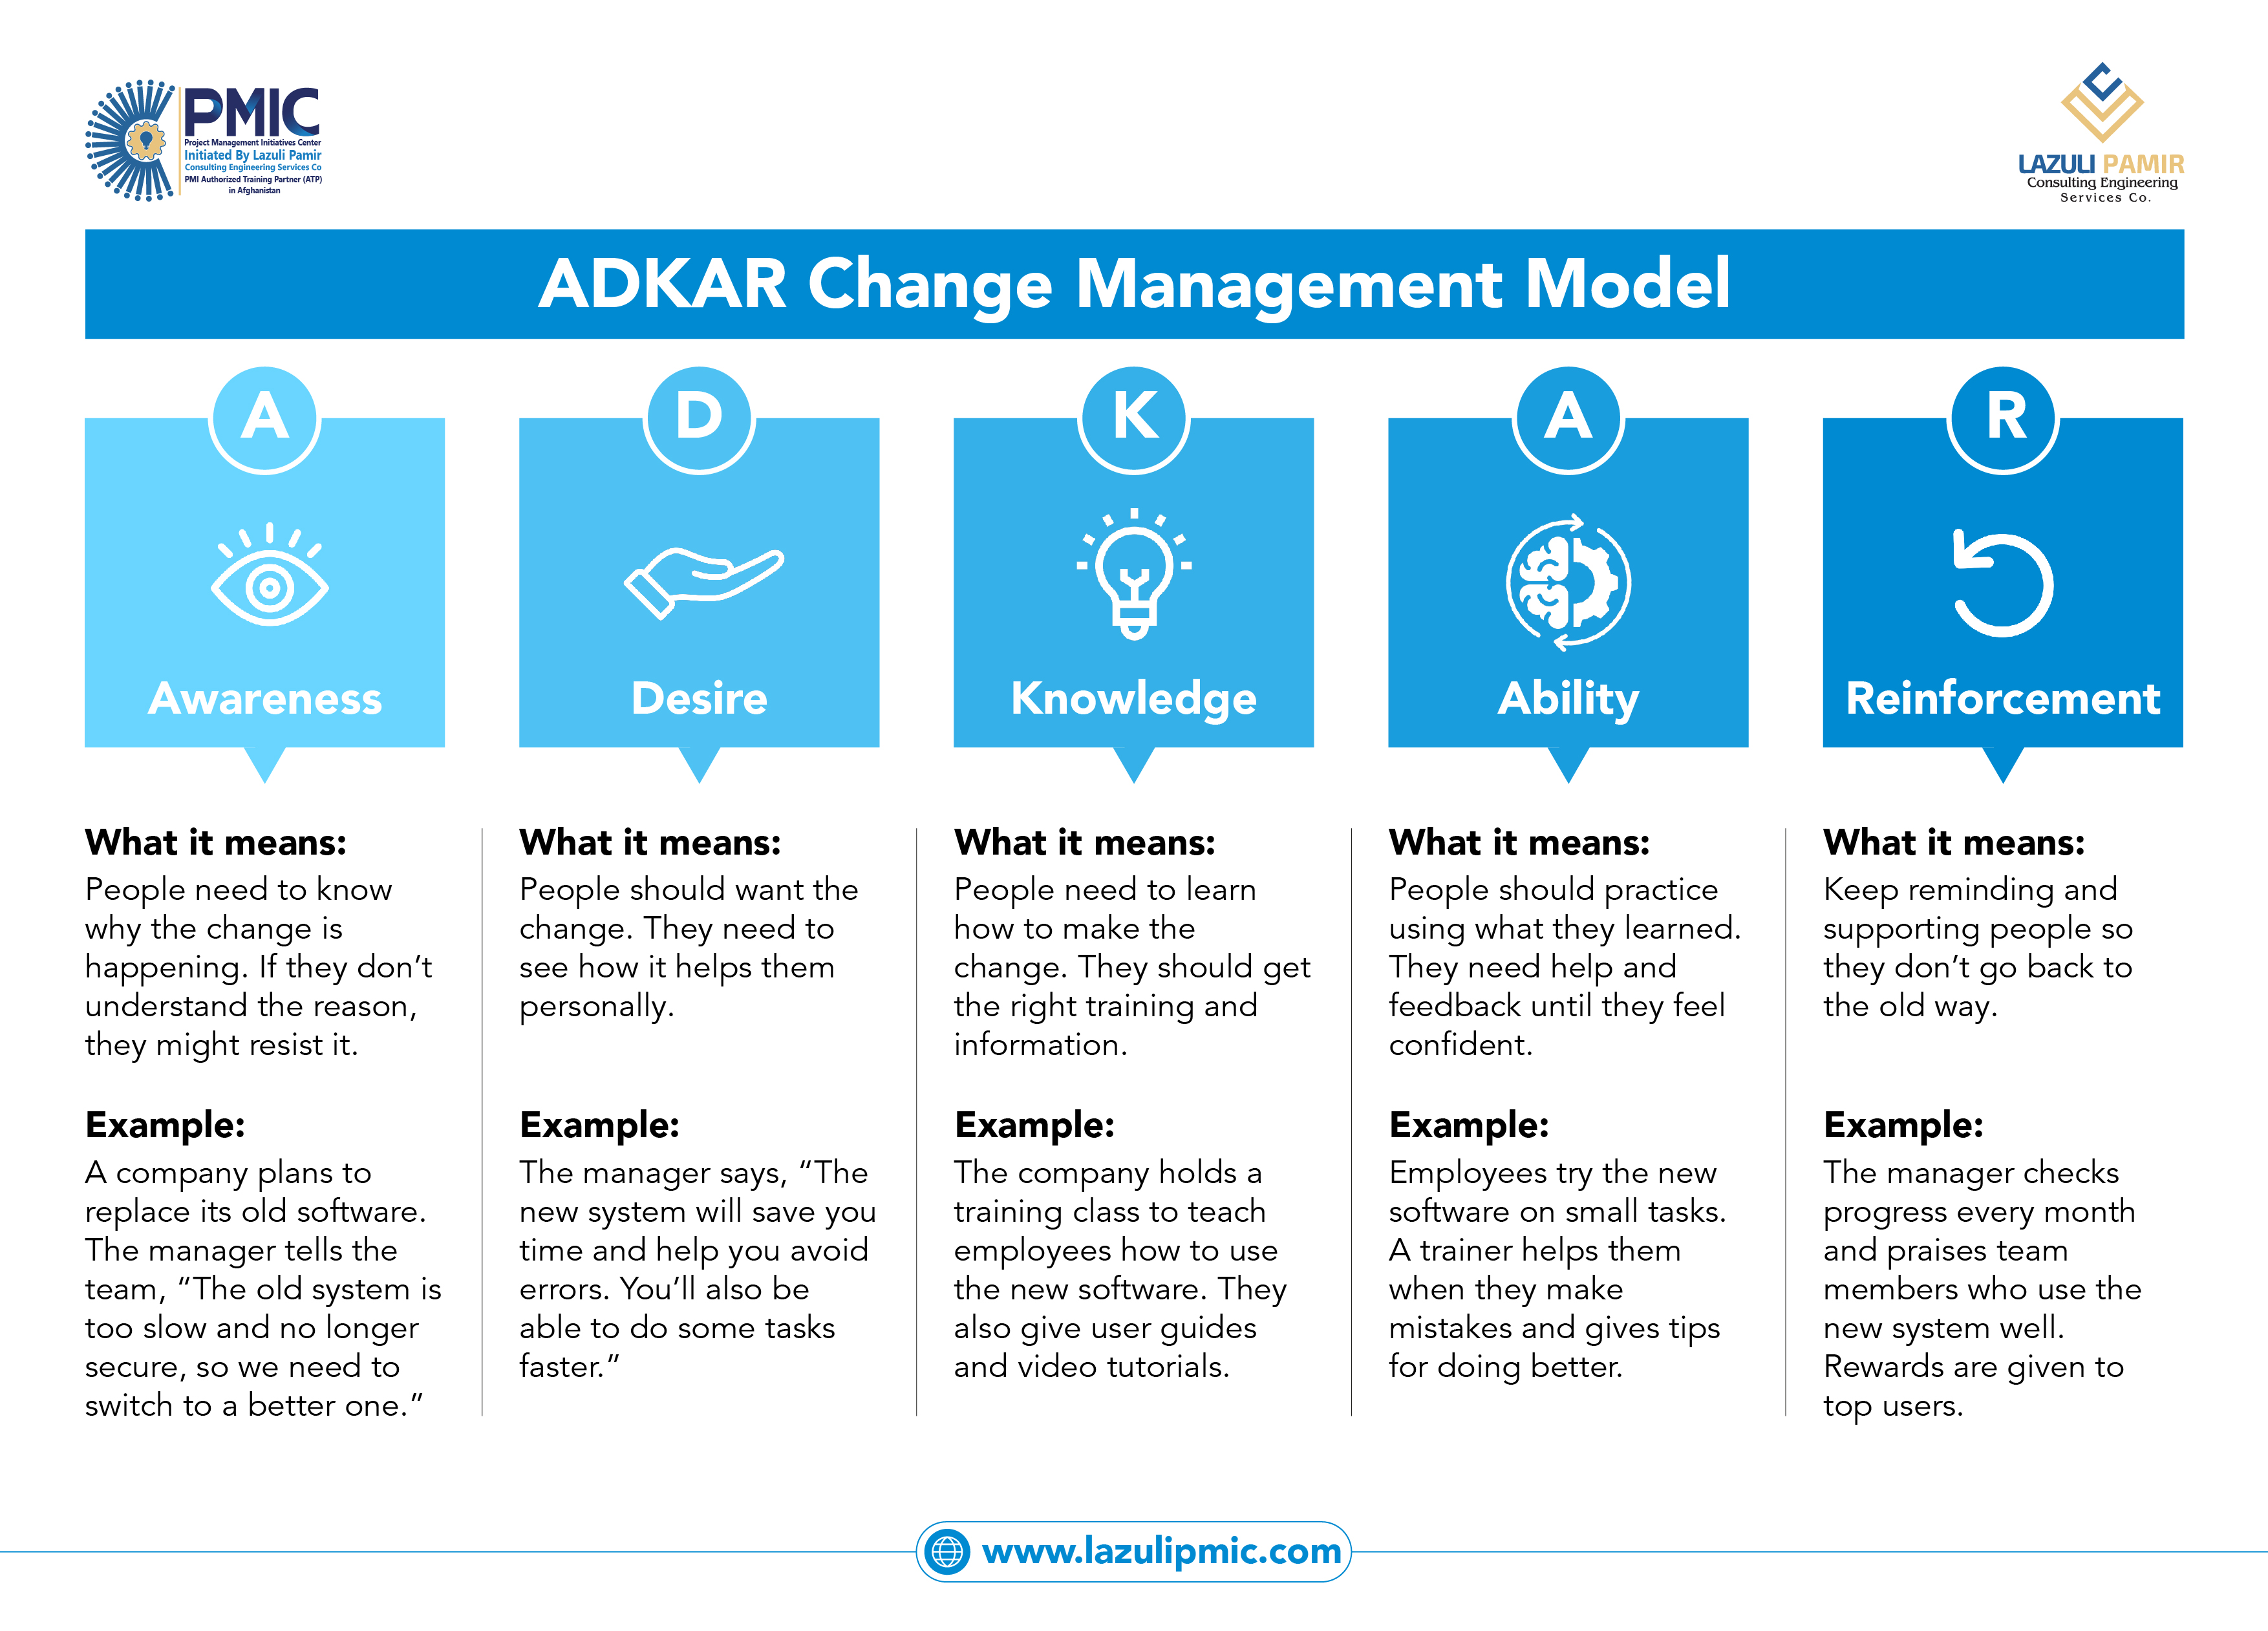
ADKAR Change Management Model – Managing Change at the Individual Level
The ADKAR Change Management Model explains how successful change happens by focusing on individuals, not just processes. It breaks change into five essential building blocks: Awareness of the need for change, Desire to support it, Knowledge of how to change, Ability to implement new skills, and Reinforcement to sustain the change. This infographic provides simple explanations and practical examples, making it ideal for PMP® aspirants, project managers, and organizational leaders managing transformation initiatives.
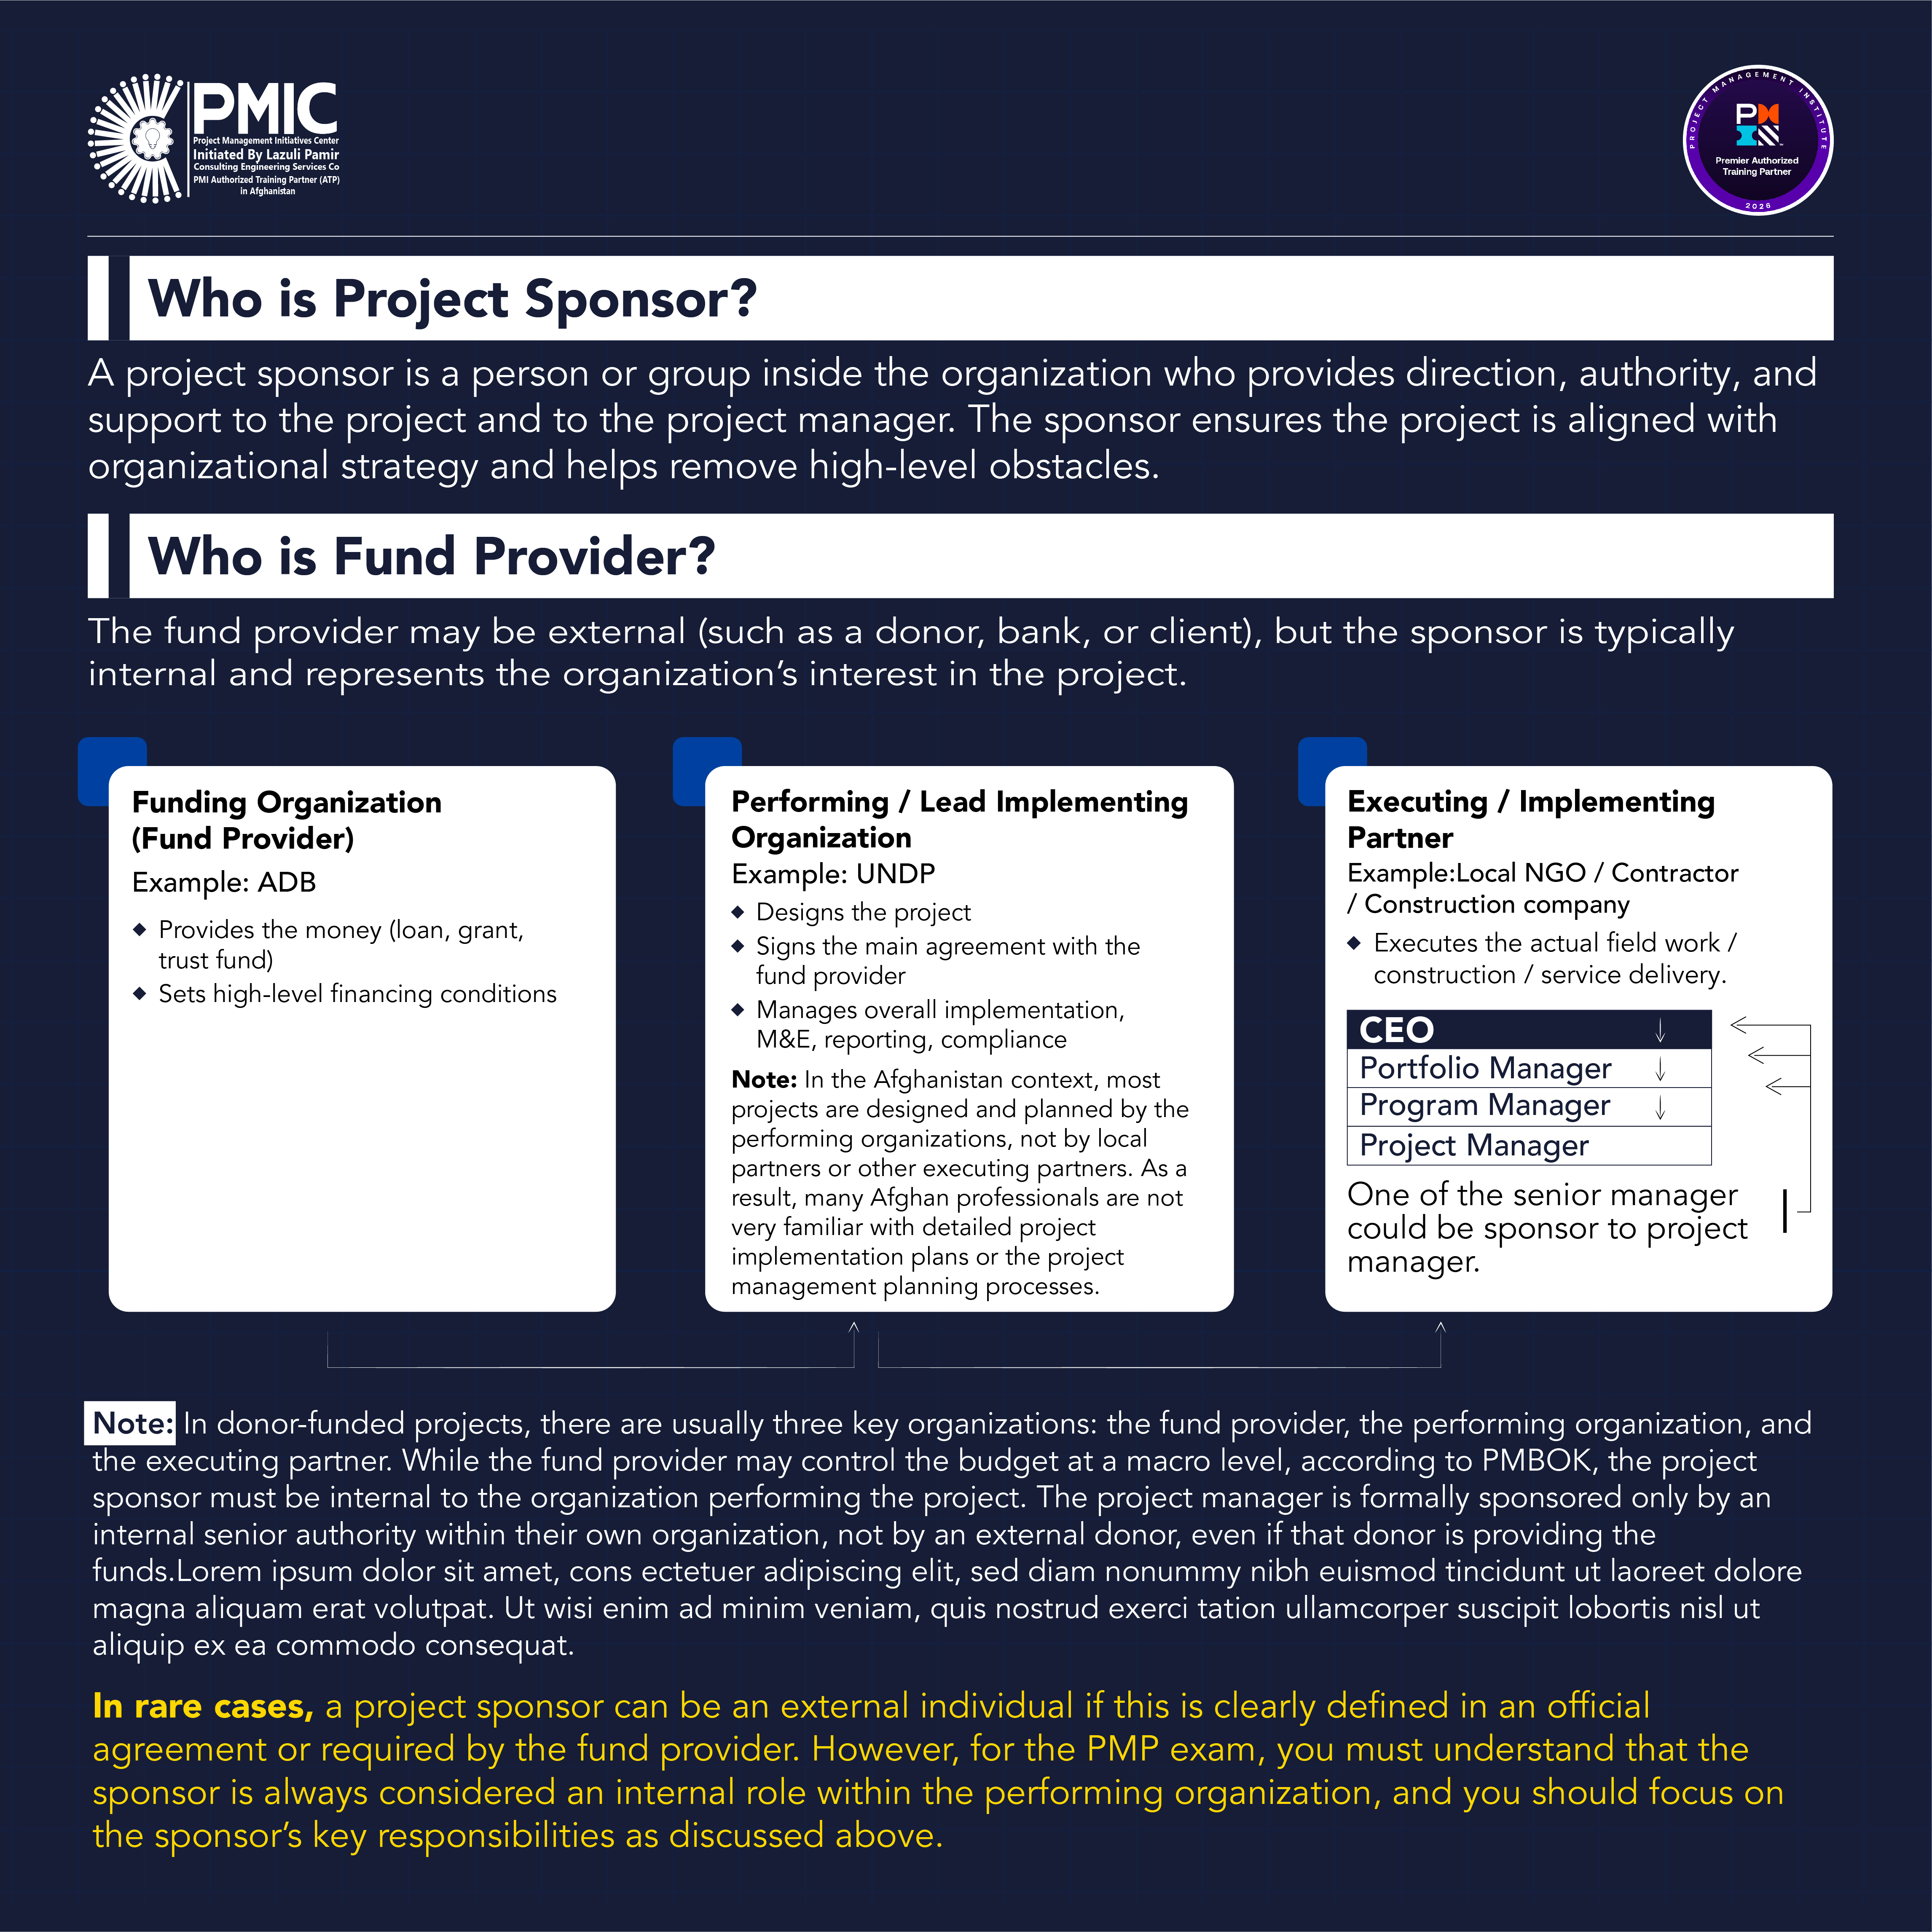
Who Is the Project Sponsor? Understanding Roles in Donor-Funded Projects
This infographic clarifies one of the most misunderstood concepts in project management: the difference between the project sponsor, fund provider, performing organization, and executing partner. It explains who truly sponsors a project according to PMBOK® guidance, especially in donor-funded environments. By highlighting internal sponsorship, authority lines, and real-world examples from Afghanistan, this visual helps project managers, NGO professionals, and PMP aspirants clearly distinguish governance roles and avoid common misconceptions.
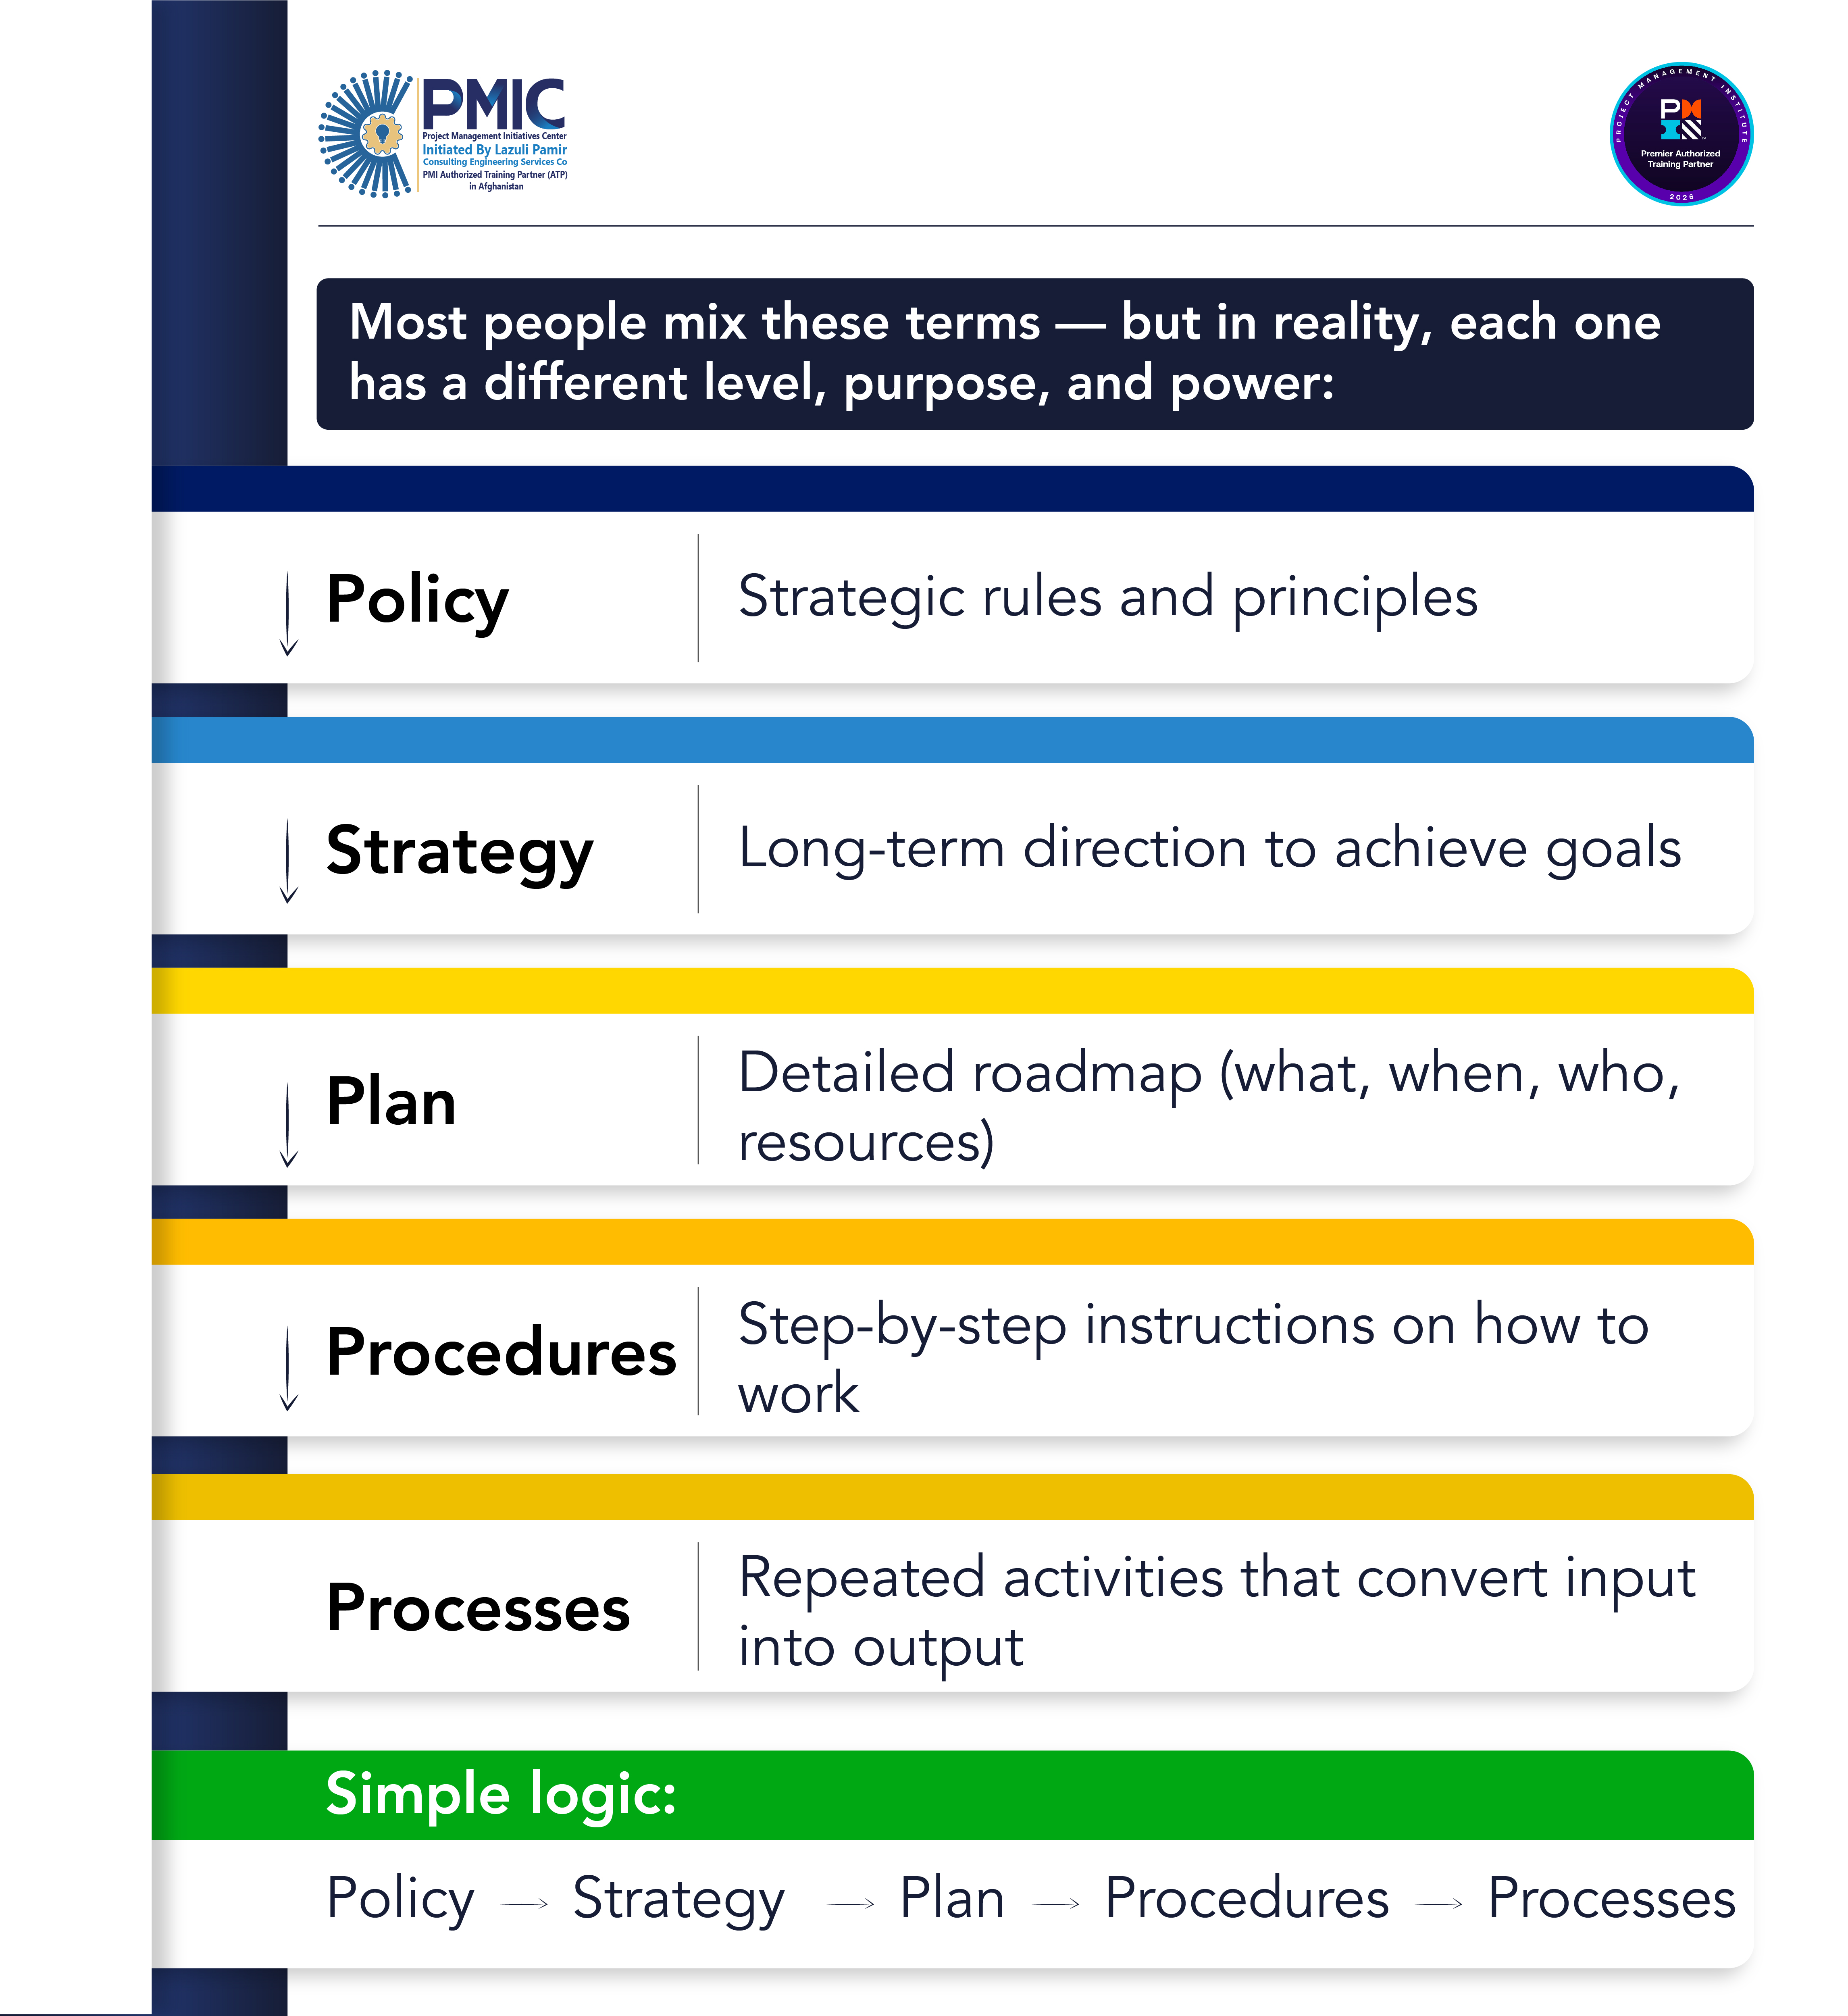
Policy, Strategy, Plan, Procedures & Processes — Understanding the Hierarchy
Many professionals use policy, strategy, plan, procedures, and processes interchangeably. In reality, each operates at a different level with a distinct purpose and authority. This infographic clearly explains how strategic rules guide long-term direction, how plans translate strategy into action, and how procedures and processes ensure consistent execution. A simple visual logic to strengthen governance, management, and project success.
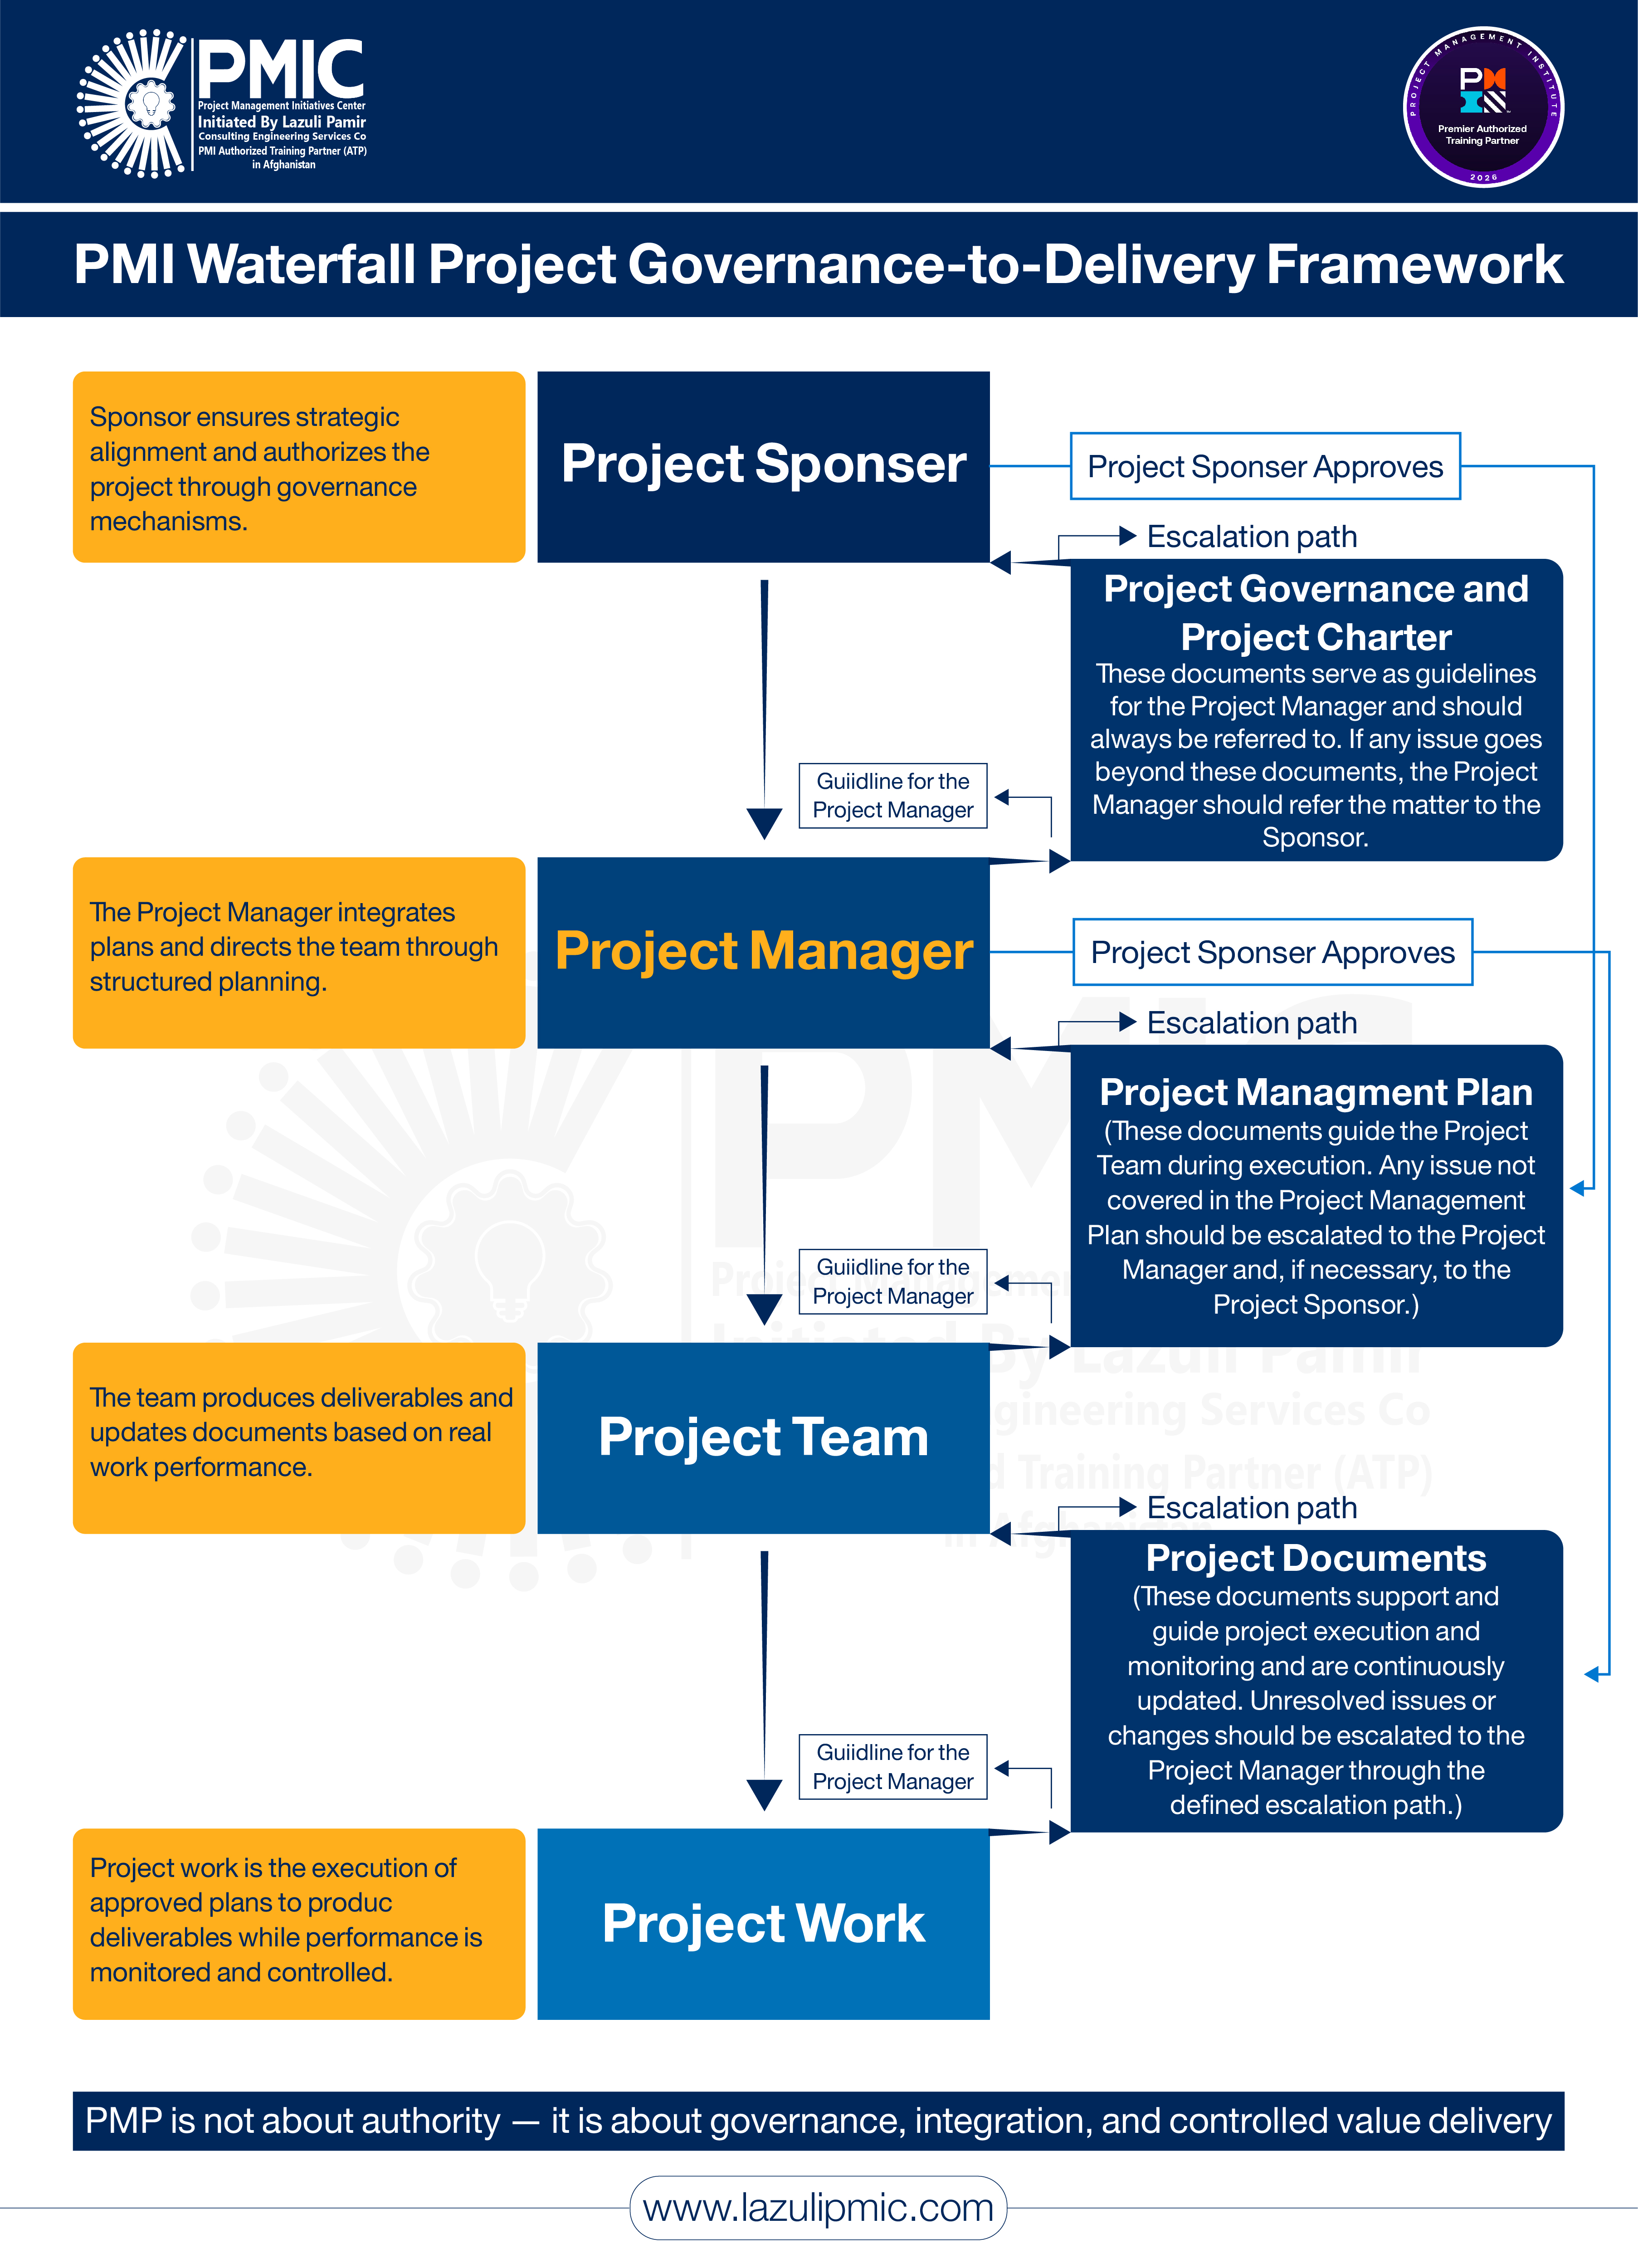
PMI Waterfall Project Governance-to-Delivery Framework | PMP® Concept Infographic by PMIC
Download the PMI Waterfall Project Governance-to-Delivery Framework Infographic developed by PMIC (Project Management Initiatives Center) to clearly understand how project governance, roles, approvals, escalation paths, and delivery flow operate in a traditional (predictive / waterfall) project environment. This visual framework explains the end-to-end governance structure from Project Sponsor → Project Manager → Project Team → Project Work, aligned with PMI®, PMBOK® Guide, and PMP® Exam Content Outline (ECO). It highlights decision authority, accountability, escalation mechanisms, and document control, helping PMP aspirants move beyond theory into real-world project execution logic. Key concepts covered: - Role of the Project Sponsor in governance and authorization - Project Charter and governance escalation paths - Project Manager’s integration and control responsibilities - Project Management Plan vs. Project Documents - Structured execution and performance monitoring - Governance-driven value delivery (not authority-driven control) This infographic is ideal for PMP candidates, project managers, engineers, NGO professionals, government project staff, trainers, and PMO teams seeking clarity on waterfall governance and delivery discipline. Keywords: PMI Waterfall Framework, PMP Governance Infographic, Project Governance PMI, PMP Process Flow, Project Sponsor vs Project Manager, Waterfall Project Management, PMP Exam Concepts, PMBOK Governance Model, PMIC PMP Resources, Project Delivery Framework